Latent View Analytics Ltd
About
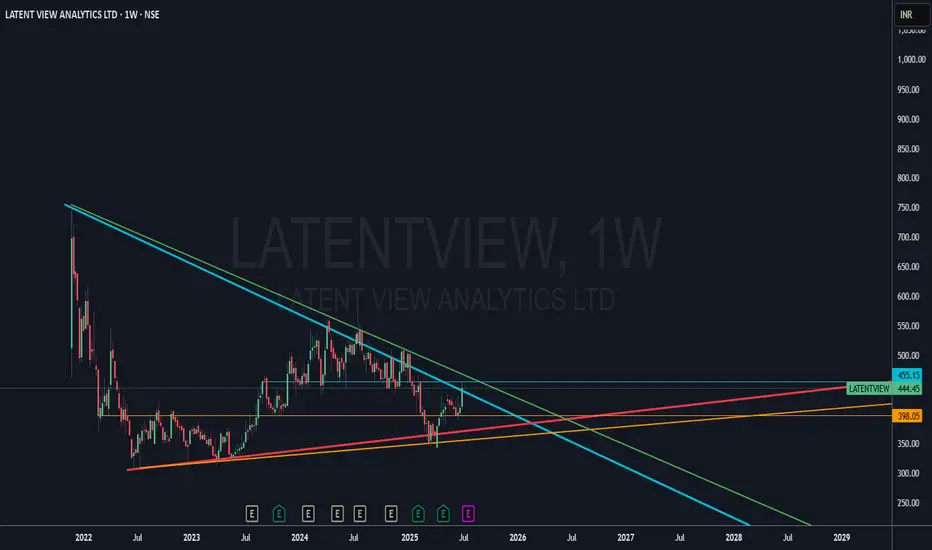
Latent View Analytics Ltd provides analytics services such as data and analytics consulting, business analytics & insights, advanced predictive analytics, data engineering, and digital solutions. The company provides services to blue-chip companies in Technology, BFSI, CPG & Retail, Industrials, and other industry domains.
LatentView has shown a strong weekly bullish candle backed by volume and trendline breakout after long consolidation. If it manages to close above ₹450, it may confirm a multi-timeframe breakout.
📌 Key technical positives:
Bullish structure on both weekly and monthly charts
Strong bounce from long-term support
Momentum indicators turning up
Volumes supporting price action
📈 Eyes on the ₹491–₹561 zone as potential next resistance range.
🔎 Fundamentally, the company shows solid revenue and profit growth (28% 3Y sales CAGR), high ROE, debt-free status, and consistent promoter holding above 65%.
🧠 Disclaimer: For educational and research purposes only. No buy/sell advice.
📝 Chart Purpose & Disclaimer:
This chart is shared purely for educational and personal tracking purposes. I use this space to record my views and improve decision-making over time.
Investment Style:
All stocks posted are for long-term investment or minimum positional trades only. No intraday or speculative trades are intended.
⚠️ Disclaimer:
I am not a SEBI registered advisor. These are not buy/sell recommendations. Please consult a qualified financial advisor before taking any investment decision. I do not take responsibility for any profit or loss incurred based on this content.
About
Latent View Analytics Ltd provides analytics services such as data and analytics consulting, business analytics & insights, advanced predictive analytics, data engineering, and digital solutions. The company provides services to blue-chip companies in Technology, BFSI, CPG & Retail, Industrials, and other industry domains.
LatentView has shown a strong weekly bullish candle backed by volume and trendline breakout after long consolidation. If it manages to close above ₹450, it may confirm a multi-timeframe breakout.
📌 Key technical positives:
Bullish structure on both weekly and monthly charts
Strong bounce from long-term support
Momentum indicators turning up
Volumes supporting price action
📈 Eyes on the ₹491–₹561 zone as potential next resistance range.
🔎 Fundamentally, the company shows solid revenue and profit growth (28% 3Y sales CAGR), high ROE, debt-free status, and consistent promoter holding above 65%.
🧠 Disclaimer: For educational and research purposes only. No buy/sell advice.
📝 Chart Purpose & Disclaimer:
This chart is shared purely for educational and personal tracking purposes. I use this space to record my views and improve decision-making over time.
Investment Style:
All stocks posted are for long-term investment or minimum positional trades only. No intraday or speculative trades are intended.
⚠️ Disclaimer:
I am not a SEBI registered advisor. These are not buy/sell recommendations. Please consult a qualified financial advisor before taking any investment decision. I do not take responsibility for any profit or loss incurred based on this content.
Exención de responsabilidad
La información y las publicaciones no pretenden ser, ni constituyen, asesoramiento o recomendaciones financieras, de inversión, de trading o de otro tipo proporcionadas o respaldadas por TradingView. Más información en Condiciones de uso.
Exención de responsabilidad
La información y las publicaciones no pretenden ser, ni constituyen, asesoramiento o recomendaciones financieras, de inversión, de trading o de otro tipo proporcionadas o respaldadas por TradingView. Más información en Condiciones de uso.