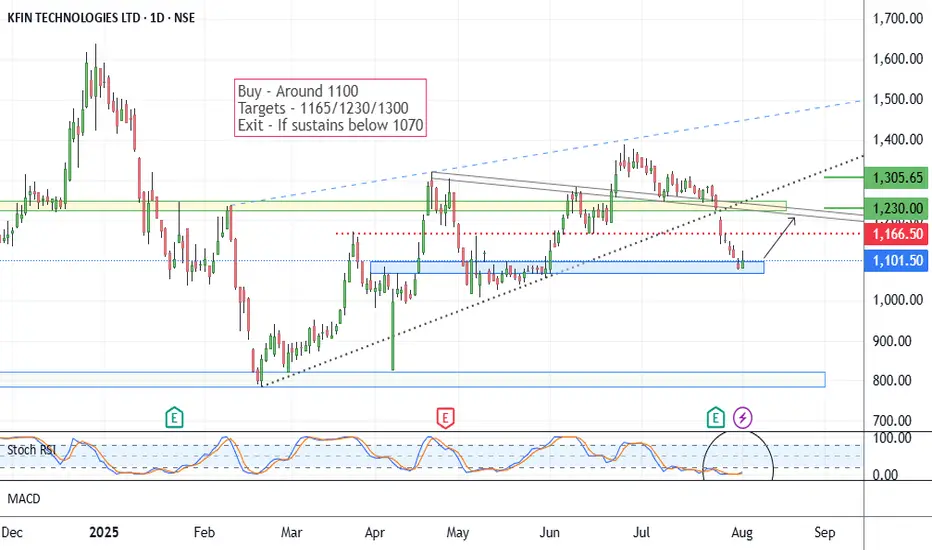
In the last month of July, the stock price fell from 1380 to 1100. Presently seems on a support area. As you may see on the chart. This setup is based on a reversal possibility from the support range around 1080.
Stochastic RSI shows a reversal sign.
Possible targets may be 1165/1230 and 1305.
If it sustains below 1070-1050 levels, the setup will go weak. Below 1070, the exit plan should be considered.
One has to keep the position size according to the risk management.
All these illustrations are my personal view, only for learning and observation purposes; this is not buying or selling advice.
All the best.
Exención de responsabilidad
La información y las publicaciones que ofrecemos, no implican ni constituyen un asesoramiento financiero, ni de inversión, trading o cualquier otro tipo de consejo o recomendación emitida o respaldada por TradingView. Puede obtener información adicional en las Condiciones de uso.