Target for $JNUG at different $gold spot prices $GDX $NUGT $GLD
The ascending triangle in the gold price displayed here:

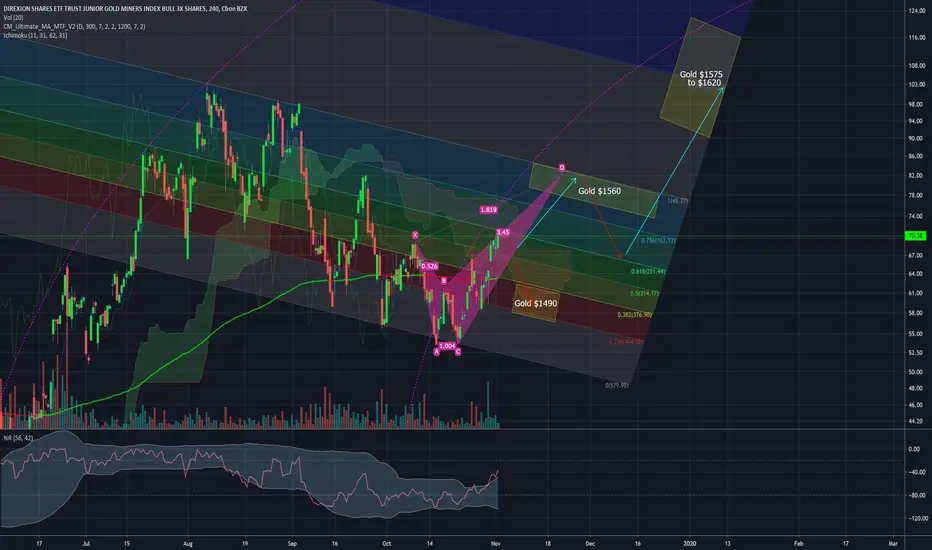
Has produced a double bottom and bullish XABCD pattern displayed above in pink on the JNUG chart.
A return to the recent highs will likely sendJNUG back into the $76 to $83 range.
Gold is, momentarily, no longer inversely correlated with the stock market. Negative real interest rates globally and the inverse correlation with USD is now the primary driving force in the price of gold.
Lower interest rates and (not QE ) QE are repricing the US dollar against major world currencies and gold:

Has produced a double bottom and bullish XABCD pattern displayed above in pink on the
A return to the recent highs will likely send
Gold is, momentarily, no longer inversely correlated with the stock market. Negative real interest rates globally and the inverse correlation with USD is now the primary driving force in the price of gold.
Lower interest rates and (not QE ) QE are repricing the US dollar against major world currencies and gold:
Publicaciones relacionadas
Exención de responsabilidad
La información y las publicaciones que ofrecemos, no implican ni constituyen un asesoramiento financiero, ni de inversión, trading o cualquier otro tipo de consejo o recomendación emitida o respaldada por TradingView. Puede obtener información adicional en las Condiciones de uso.