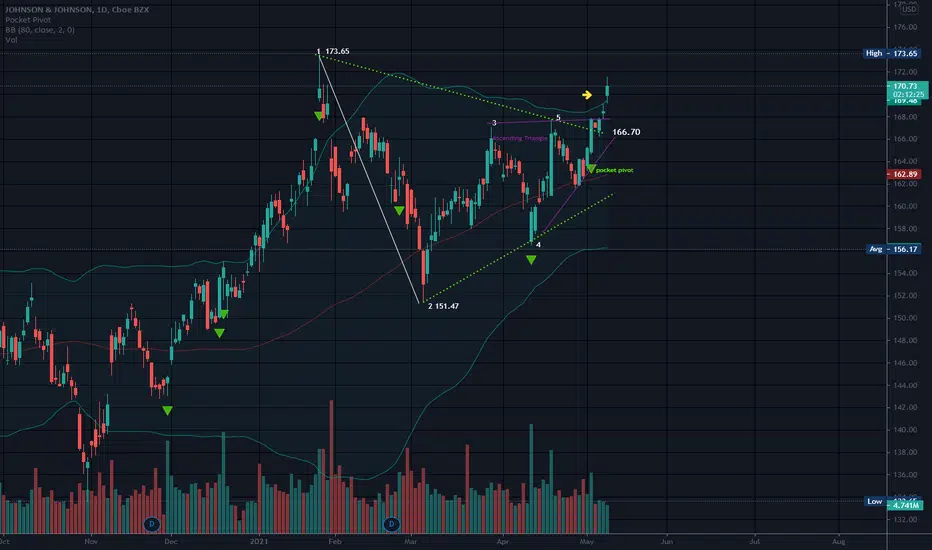
173.65 is the long term high.
JNJ has broken free of both triangles, as well as the bollinger bands.
Bollinger bands are set on this chart using an eighty day moving average verses the norm of 20. Price is above the top band today which is bullish, but it is likely that price will return to the inside of the bands.
No recommendation
Exención de responsabilidad
La información y las publicaciones que ofrecemos, no implican ni constituyen un asesoramiento financiero, ni de inversión, trading o cualquier otro tipo de consejo o recomendación emitida o respaldada por TradingView. Puede obtener información adicional en las Condiciones de uso.