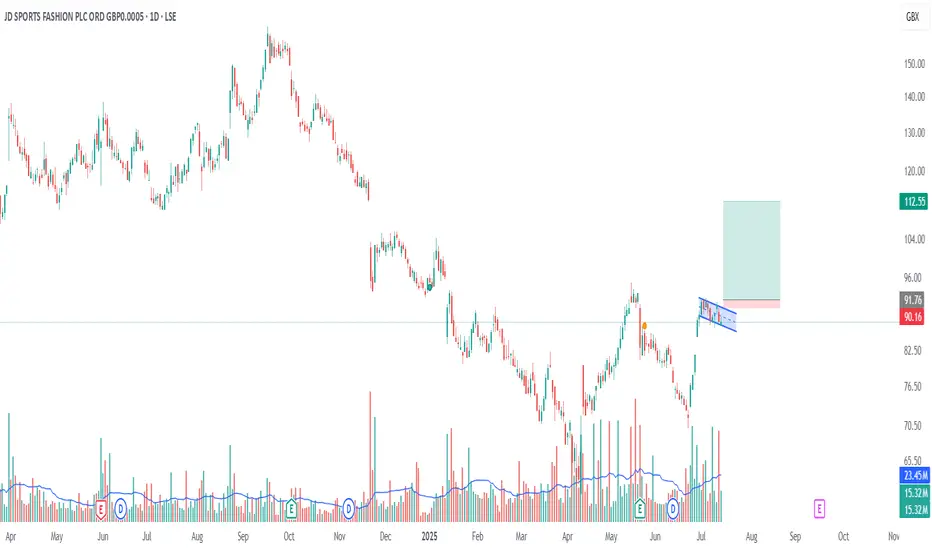
A bull flag pattern is forming on the 1-day chart, supported by a steady increase in volume—suggesting growing bullish momentum.
Flagpole base: ~72
Potential breakout level: ~92
First price target (PT1): ~100 (next key resistance level)
Measured move target (PT2): ~112 (based on flagpole height)
This setup indicates a strong potential for continuation if price breaks above the 92 level with volume confirmation.
Flagpole base: ~72
Potential breakout level: ~92
First price target (PT1): ~100 (next key resistance level)
Measured move target (PT2): ~112 (based on flagpole height)
This setup indicates a strong potential for continuation if price breaks above the 92 level with volume confirmation.
Exención de responsabilidad
La información y las publicaciones que ofrecemos, no implican ni constituyen un asesoramiento financiero, ni de inversión, trading o cualquier otro tipo de consejo o recomendación emitida o respaldada por TradingView. Puede obtener información adicional en las Condiciones de uso.