Stock Analysis: IZMO Ltd. based on the chart and fundamentals:
Technical & Chart Pattern Analysis (Weekly Chart)
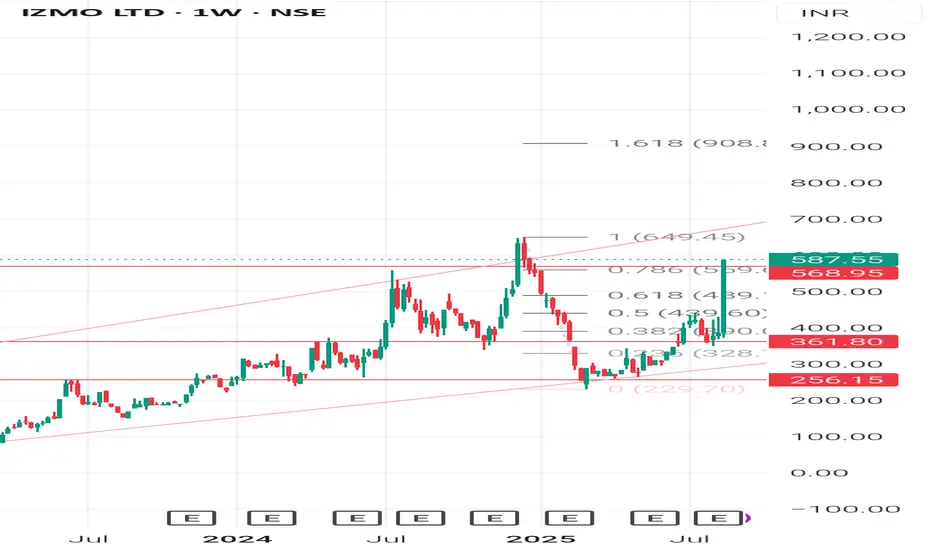
Current Price: 587.55 (+19.99% last move - strong momentum).
Fibonacci Levels (retracement from high):
0.382 - 390 (past support, now strong base).
0.5 - 439 (intermediate support).
0.618 - 499 (recent breakout level).
0.786 - 559 (crossed successfully).
1.0 - 649 (major resistance).
1.618 - 908 (next extended target).
Support Levels: 499 - 439 - 390.
Resistance Levels: 649 - 750 - 908.
Candlestick Pattern: Recent weekly candle is a strong bullish marubozu (no wick, full green), indicating aggressive buying and potential continuation of trend.
Swing Analysis: Stock bounced strongly from 256 (swing low) and has reclaimed key retracement levels, showing a trend reversal with momentum.
Chart Pattern:
Broke out of falling consolidation with volume.
Trading inside a long-term upward channel.
Target zones: 649 (supply zone) - If broken, 900 becomes visible.
Fundamental Snapshot - IZMO vs Competitors
Ratio / Metric IZMO Ltd. KPIT Tech Tata Elxsi
P/E (TTM) -23x -45x -65x
ROE -17% -20% -28%
Debt-to-Equity Low (<0.2) Low Low
Revenue Growth (YoY) Strong double-digit Moderate Stable
Market Cap -Small-cap Mid-cap Mid-cap/Large-cap
Learning: IZMO trades at a lower P/E compared to KPIT/Tata Elxsi, indicating undervaluation relative to peers if growth sustains. However, liquidity and volatility risk is higher since IZMO is a small-cap.
🎓 Student Learnings from This Chart
1. Fibonacci Retracement works well in identifying support/resistance during upswings.
2. Volume + bullish marubozu candles = trend confirmation.
3. Small-cap IT/auto-tech companies can give sharp rallies but also sharp corrections - risk management is critical.
4. Always compare fundamentals with peers - Lower P/E can mean undervaluation OR slower growth.
5. Invest gradually (SIP style) instead of chasing a rally after 20%+ up moves.
👉Disclaimer
This analysis is for educational purposes only. It is not investment advice. Stock markets are subject to risks. Please consult your financial advisor before investing.
#StockMarketIndia #TechnicalAnalysis #FundamentalAnalysis #SwingTrading #ChartPatterns #CandlestickPatterns #StudentInvestors #LongTermWealth #SmallCapStocks #InvestingBasics
Technical & Chart Pattern Analysis (Weekly Chart)
Current Price: 587.55 (+19.99% last move - strong momentum).
Fibonacci Levels (retracement from high):
0.382 - 390 (past support, now strong base).
0.5 - 439 (intermediate support).
0.618 - 499 (recent breakout level).
0.786 - 559 (crossed successfully).
1.0 - 649 (major resistance).
1.618 - 908 (next extended target).
Support Levels: 499 - 439 - 390.
Resistance Levels: 649 - 750 - 908.
Candlestick Pattern: Recent weekly candle is a strong bullish marubozu (no wick, full green), indicating aggressive buying and potential continuation of trend.
Swing Analysis: Stock bounced strongly from 256 (swing low) and has reclaimed key retracement levels, showing a trend reversal with momentum.
Chart Pattern:
Broke out of falling consolidation with volume.
Trading inside a long-term upward channel.
Target zones: 649 (supply zone) - If broken, 900 becomes visible.
Fundamental Snapshot - IZMO vs Competitors
Ratio / Metric IZMO Ltd. KPIT Tech Tata Elxsi
P/E (TTM) -23x -45x -65x
ROE -17% -20% -28%
Debt-to-Equity Low (<0.2) Low Low
Revenue Growth (YoY) Strong double-digit Moderate Stable
Market Cap -Small-cap Mid-cap Mid-cap/Large-cap
Learning: IZMO trades at a lower P/E compared to KPIT/Tata Elxsi, indicating undervaluation relative to peers if growth sustains. However, liquidity and volatility risk is higher since IZMO is a small-cap.
🎓 Student Learnings from This Chart
1. Fibonacci Retracement works well in identifying support/resistance during upswings.
2. Volume + bullish marubozu candles = trend confirmation.
3. Small-cap IT/auto-tech companies can give sharp rallies but also sharp corrections - risk management is critical.
4. Always compare fundamentals with peers - Lower P/E can mean undervaluation OR slower growth.
5. Invest gradually (SIP style) instead of chasing a rally after 20%+ up moves.
👉Disclaimer
This analysis is for educational purposes only. It is not investment advice. Stock markets are subject to risks. Please consult your financial advisor before investing.
#StockMarketIndia #TechnicalAnalysis #FundamentalAnalysis #SwingTrading #ChartPatterns #CandlestickPatterns #StudentInvestors #LongTermWealth #SmallCapStocks #InvestingBasics
Publicaciones relacionadas
Exención de responsabilidad
La información y las publicaciones no constituyen, ni deben considerarse como asesoramiento o recomendaciones financieras, de inversión, de trading o de otro tipo proporcionadas o respaldadas por TradingView. Más información en Condiciones de uso.