Executive Summary
ITC’s financial performance for Q4 FY25 and the full fiscal year demonstrates operational stability in its core businesses, with headline profits influenced by exceptional, non-recurring gains. The company continues to manage challenging market conditions with marginal improvement in recurring profits and robust dividends for shareholders.
Key Financial Highlights
Q4 FY25:
FY25 (Full Year)
Chart Technical Understanding
Disclaimer: lnkd.in/gJJDnvn2
ITC’s financial performance for Q4 FY25 and the full fiscal year demonstrates operational stability in its core businesses, with headline profits influenced by exceptional, non-recurring gains. The company continues to manage challenging market conditions with marginal improvement in recurring profits and robust dividends for shareholders.
Key Financial Highlights
Q4 FY25:
- Gross Revenue: ₹18,266 crore (up 9.2% YoY)
- EBITDA: ₹5,986 crore (up 2.5% YoY)
- Profit Before Tax (PBT): ₹6,417 crore (up 2.1% YoY)
- Profit After Tax (PAT): ₹4,875 crore (up 0.8% YoY)
- Headline Net Profit: ₹19,561.57 crore (reflects one-time exceptional gain, not recurring profit)
FY25 (Full Year)
- Gross Revenue: ₹73,465 crore (up 10.2% YoY)
- PAT: ₹20,092 crore (up 0.9% YoY)
- Dividend: Final dividend of ₹7.85/share for FY25, bringing total annual dividend to ₹14.35/share.
- Analysts view ITC’s core business as resilient under tough conditions, with “modest” organic profit growth.
- Strong cash flows and consistent dividends make ITC an attractive pick for risk-averse, long-term investors.
- The demerger of the hotel business is expected to sharpen management focus and potentially enable better growth performance in future periods.
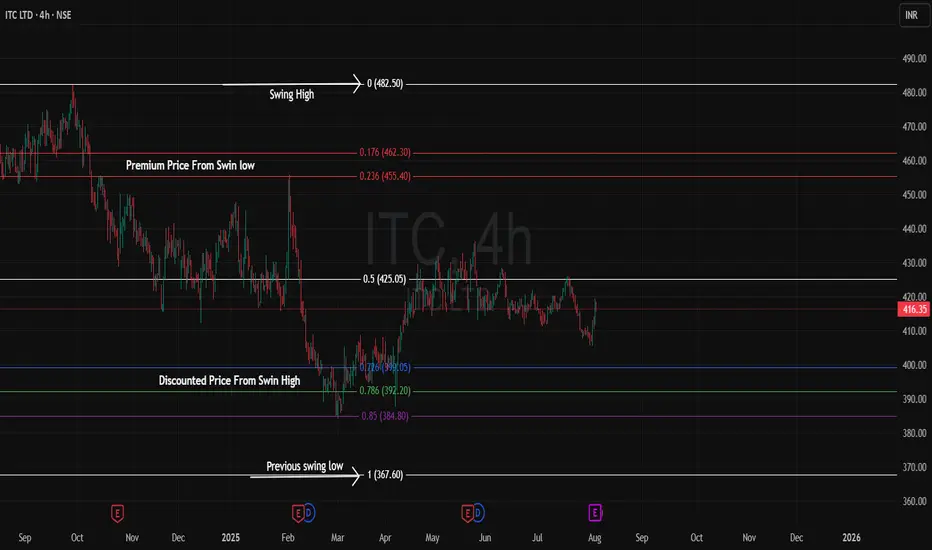
Chart Technical Understanding
- The Fibonacci retracement tool is applied from the recent swing high to the swing low (in a downtrend), or from swing low to swing high (in an uptrend).
- The area from 0% to 50% (below midpoint) signals discount, and 50% to 100% (above midpoint) signals premium.
- If price falls deeply from its swing high, you can quantify how much is discounted by seeing how far below the 50% line it is.
- If price rallies back above the 50% level after retracing, it enters the premium area, indicating the asset is again priced at a premium relative to its prior correction.
Disclaimer: lnkd.in/gJJDnvn2
Exención de responsabilidad
La información y las publicaciones que ofrecemos, no implican ni constituyen un asesoramiento financiero, ni de inversión, trading o cualquier otro tipo de consejo o recomendación emitida o respaldada por TradingView. Puede obtener información adicional en las Condiciones de uso.