Double Bottom + Falling Wedge = Breakout Loading on IPCALAB
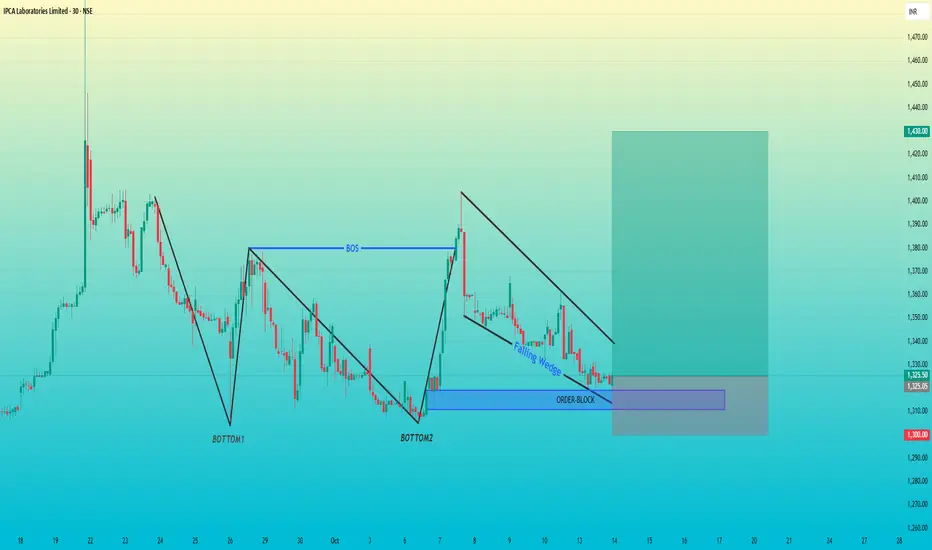
Chart Overview
Pattern: Falling Wedge inside a confirmed bullish structure
Structure Break: BOS (Break of Structure) already confirmed
Key Levels:
Order Block Zone: Around ₹1300–₹1310
Current Price: ₹1325
Target Zone: ₹1430
Stop-Loss: Below ₹1300
Technical Breakdown
1. Double Bottom
The formation of Bottom1 and Bottom2 shows a strong demand base.
The BOS (Break of Structure) after Bottom2 confirms that buyers took control.
2. Falling Wedge Pattern
After the BOS, the price is consolidating in a Falling Wedge, which is typically a bullish continuation pattern.
Price respecting the wedge boundaries suggests compression — a breakout to the upside can trigger momentum.
3. Order Block Zone
The blue rectangular area marks a bullish order block from the last strong bullish rally.
Price has retraced back into this OB, creating an ideal entry point if bullish rejection appears.
4. Trade Setup
Entry: Near ₹1320–₹1325
Stop-Loss: Below ₹1300 (OB invalidation)
Target: ₹1430
RR Ratio: ≈ 1:4
Operación cerrada: precio stop alcanzado
Exención de responsabilidad
La información y las publicaciones no constituyen, ni deben considerarse como asesoramiento o recomendaciones financieras, de inversión, de trading o de otro tipo proporcionadas o respaldadas por TradingView. Más información en Condiciones de uso.
Exención de responsabilidad
La información y las publicaciones no constituyen, ni deben considerarse como asesoramiento o recomendaciones financieras, de inversión, de trading o de otro tipo proporcionadas o respaldadas por TradingView. Más información en Condiciones de uso.