Intel  INTC will report Q3 earnings this week at a time when the chip designer and aspiring foundry firm's shares have doubled in less than three months. What does INTC's chart and fundamental analysis show?
Let's take a look:
Intel's Fundamental Analysis
Intel plans to release its latest results on Thursday after the bell, but INTC under new CEO Lip-Bu Tan has become as well known for deal-making as it has for anything it does operationally.
The list of deals that INTC struck since just April is long.
First, Intel and Taiwan Semiconductor TSM -- INTC's main rival in the silicon-wafer-foundry business -- agreed to form a U.S.-based joint venture to boost Intel's foundry operation. Plans called for TSM to own 20% of that business.
Then in August, the Trump administration converted what had been grant money from the federal government's CHIPS and Science Act and Secure Enclave program into the purchase of Intel equity. That gave the U.S. government a roughly 10% stake in the company that was valued at $8.9 billion at the time.
Shortly thereafter, Softbank SFTBY bought $2 billion of Intel stock, providing the firm with some much welcome capital.
And lastly, Nvidia NVDA formed a strategic partnership with INTC in September and made a $5 billion investment in the company.
The idea is for the two potential rivals to collaborate in the co-development of products for data centers and personal computers. Intel will manufacture custom CPUs for Nvidia as part of the deal, as well combining Intel CPUs and Nvidia GPUs for use in artificial-intelligence-capable PCs.
All of those deals have helped push INTC stock up more than 100% in recent months, from an $18.97 intraday low on Aug. 1 to $38.10 as of Monday's close.
As for Intel's upcoming earnings, Wall Street expects the company to report zero adjusted earnings per share on roughly $13.1 billion of revenue.
While that would amount to a 1.3% year-over-year revenue contraction, the adjusted bottom line would compare well to Intel's $0.46 loss per share in Q3 2024.
Still, only two of the 31 sell-side analysts that I can find that cover Intel have revised their earnings estimates higher since the quarter began. By contrast, 25 have revised those numbers lower, while four have left their estimates unchanged.
Intel's Technical Analysis
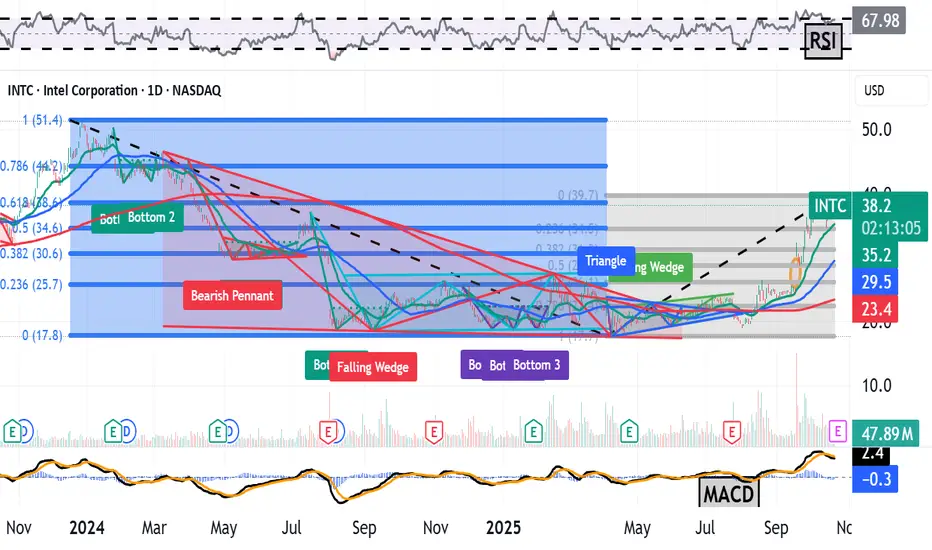
Next, let's look at INTC's two-year chart as of Friday afternoon:

Readers will see that Intel shares appear to be trading these days according to Fibonacci sequence retracement levels (the blue- and gray-shaded fields).
Laid under the shaded field, readers will also see a falling-wedge pattern of bullish reversal, marked with a blue box and jagged blue line.
From a technical perspective, this pattern set up Intel's July-to-September rally.
However, that rally ran out of gas very close to the 61.8% Fibonacci retracement level created by INTC's sell-off between December 2023 and April 2025. Still, the stock found support coming off of its September 2025 top at the 23.6% Fibonacci retracement level (one of the lines in the gray field at the chart's right).
Intel has since started to create a potential base of consolidation (i.e., a trading range) at close to its recent highs. The Fibonacci retracement levels are the pivots in both directions for this stock.
Meanwhile, Intel's secondary technical indicators look mixed.
On one hand, the stock's Relative Strength Index (the gray line at the chart's top) is coming out of a technically overbought condition and remains quite robust.
That said, Intel's daily Moving Average Convergence Divergence indicator (or "MACD," marked with black and gold lines and blue bars at the chart's bottom) is more equivocal.
The histogram of the stock's 9-day Exponential Moving Average (or "EMA," denoted by the blue bars) has moved below the zero-bound, which is usually a short-term bearish signal.
The 12-day-EMA (the black line) has crossed below the 26-day EMA (gold line), which is also normally a bearish sign. But both of those lines are still running above zero, which is bullish.
An Options Option
Add it all up and Intel's chart seems fairly neutral.
Some option traders who are looking to get long the stock but don't want to tie up too much capital might choose to employ a combination of a long call and a short put. Here's an example including option strikes related to pivot points indicated by Fibonacci levels:
-- Long one Oct 24 call with a $40 strike price (Intel's recent high) for about $1.30.
-- Short one Oct 24 put with a $34 strike (the above chart's indicated Fibonacci support level) for roughly $0.90.
Net Debit: $0.40.
Should Intel remain between $34 and $40 through the above options' expiration date, the trader will be out the $0.40 paid.
Alternatively, should the stock trade higher than $40 at expiration, the trader will be long 100 shares at a $40.40 net basis.
And should the shares trade below $34 at expiration, the trader will be long 100 shares at a $34.40 net basis.
(Moomoo Technologies Inc. Markets Commentator Stephen "Sarge" Guilfoyle was long INTC at the time of writing this column.)
This article discusses technical analysis, other approaches, including fundamental analysis, may offer very different views. The examples provided are for illustrative purposes only and are not intended to be reflective of the results you can expect to achieve. Specific security charts used are for illustrative purposes only and are not a recommendation, offer to sell, or a solicitation of an offer to buy any security. Past investment performance does not indicate or guarantee future success. Returns will vary, and all investments carry risks, including loss of principal. This content is also not a research report and is not intended to serve as the basis for any investment decision. The information contained in this article does not purport to be a complete description of the securities, markets, or developments referred to in this material. Moomoo and its affiliates make no representation or warranty as to the article's adequacy, completeness, accuracy or timeliness for any particular purpose of the above content. Furthermore, there is no guarantee that any statements, estimates, price targets, opinions or forecasts provided herein will prove to be correct.
Options trading is risky and not appropriate for everyone. Read the Options Disclosure Document (https://j.moomoo.com/017y9J) before trading. Options are complex and you may quickly lose the entire investment. Supporting docs for any claims will be furnished upon request.
Options trading subject to eligibility requirements. Strategies available will depend on options level approved.
Maximum potential loss and profit for options are calculated based on the single leg or an entire multi-leg trade remaining intact until expiration with no option contracts being exercised or assigned. These figures do not account for a portion of a multi-leg strategy being changed or removed or the trader assuming a short or long position in the underlying stock at or before expiration. Therefore, it is possible to lose more than the theoretical max loss of a strategy.
Moomoo is a financial information and trading app offered by Moomoo Technologies Inc. In the U.S., investment products and services on Moomoo are offered by Moomoo Financial Inc., Member FINRA/SIPC.
TradingView is an independent third party not affiliated with Moomoo Financial Inc., Moomoo Technologies Inc., or its affiliates. Moomoo Financial Inc. and its affiliates do not endorse, represent or warrant the completeness and accuracy of the data and information available on the TradingView platform and are not responsible for any services provided by the third-party platform.
Let's take a look:
Intel's Fundamental Analysis
Intel plans to release its latest results on Thursday after the bell, but INTC under new CEO Lip-Bu Tan has become as well known for deal-making as it has for anything it does operationally.
The list of deals that INTC struck since just April is long.
First, Intel and Taiwan Semiconductor
Then in August, the Trump administration converted what had been grant money from the federal government's CHIPS and Science Act and Secure Enclave program into the purchase of Intel equity. That gave the U.S. government a roughly 10% stake in the company that was valued at $8.9 billion at the time.
Shortly thereafter, Softbank
And lastly, Nvidia
The idea is for the two potential rivals to collaborate in the co-development of products for data centers and personal computers. Intel will manufacture custom CPUs for Nvidia as part of the deal, as well combining Intel CPUs and Nvidia GPUs for use in artificial-intelligence-capable PCs.
All of those deals have helped push INTC stock up more than 100% in recent months, from an $18.97 intraday low on Aug. 1 to $38.10 as of Monday's close.
As for Intel's upcoming earnings, Wall Street expects the company to report zero adjusted earnings per share on roughly $13.1 billion of revenue.
While that would amount to a 1.3% year-over-year revenue contraction, the adjusted bottom line would compare well to Intel's $0.46 loss per share in Q3 2024.
Still, only two of the 31 sell-side analysts that I can find that cover Intel have revised their earnings estimates higher since the quarter began. By contrast, 25 have revised those numbers lower, while four have left their estimates unchanged.
Intel's Technical Analysis
Next, let's look at INTC's two-year chart as of Friday afternoon:
Readers will see that Intel shares appear to be trading these days according to Fibonacci sequence retracement levels (the blue- and gray-shaded fields).
Laid under the shaded field, readers will also see a falling-wedge pattern of bullish reversal, marked with a blue box and jagged blue line.
From a technical perspective, this pattern set up Intel's July-to-September rally.
However, that rally ran out of gas very close to the 61.8% Fibonacci retracement level created by INTC's sell-off between December 2023 and April 2025. Still, the stock found support coming off of its September 2025 top at the 23.6% Fibonacci retracement level (one of the lines in the gray field at the chart's right).
Intel has since started to create a potential base of consolidation (i.e., a trading range) at close to its recent highs. The Fibonacci retracement levels are the pivots in both directions for this stock.
Meanwhile, Intel's secondary technical indicators look mixed.
On one hand, the stock's Relative Strength Index (the gray line at the chart's top) is coming out of a technically overbought condition and remains quite robust.
That said, Intel's daily Moving Average Convergence Divergence indicator (or "MACD," marked with black and gold lines and blue bars at the chart's bottom) is more equivocal.
The histogram of the stock's 9-day Exponential Moving Average (or "EMA," denoted by the blue bars) has moved below the zero-bound, which is usually a short-term bearish signal.
The 12-day-EMA (the black line) has crossed below the 26-day EMA (gold line), which is also normally a bearish sign. But both of those lines are still running above zero, which is bullish.
An Options Option
Add it all up and Intel's chart seems fairly neutral.
Some option traders who are looking to get long the stock but don't want to tie up too much capital might choose to employ a combination of a long call and a short put. Here's an example including option strikes related to pivot points indicated by Fibonacci levels:
-- Long one Oct 24 call with a $40 strike price (Intel's recent high) for about $1.30.
-- Short one Oct 24 put with a $34 strike (the above chart's indicated Fibonacci support level) for roughly $0.90.
Net Debit: $0.40.
Should Intel remain between $34 and $40 through the above options' expiration date, the trader will be out the $0.40 paid.
Alternatively, should the stock trade higher than $40 at expiration, the trader will be long 100 shares at a $40.40 net basis.
And should the shares trade below $34 at expiration, the trader will be long 100 shares at a $34.40 net basis.
(Moomoo Technologies Inc. Markets Commentator Stephen "Sarge" Guilfoyle was long INTC at the time of writing this column.)
This article discusses technical analysis, other approaches, including fundamental analysis, may offer very different views. The examples provided are for illustrative purposes only and are not intended to be reflective of the results you can expect to achieve. Specific security charts used are for illustrative purposes only and are not a recommendation, offer to sell, or a solicitation of an offer to buy any security. Past investment performance does not indicate or guarantee future success. Returns will vary, and all investments carry risks, including loss of principal. This content is also not a research report and is not intended to serve as the basis for any investment decision. The information contained in this article does not purport to be a complete description of the securities, markets, or developments referred to in this material. Moomoo and its affiliates make no representation or warranty as to the article's adequacy, completeness, accuracy or timeliness for any particular purpose of the above content. Furthermore, there is no guarantee that any statements, estimates, price targets, opinions or forecasts provided herein will prove to be correct.
Options trading is risky and not appropriate for everyone. Read the Options Disclosure Document (https://j.moomoo.com/017y9J) before trading. Options are complex and you may quickly lose the entire investment. Supporting docs for any claims will be furnished upon request.
Options trading subject to eligibility requirements. Strategies available will depend on options level approved.
Maximum potential loss and profit for options are calculated based on the single leg or an entire multi-leg trade remaining intact until expiration with no option contracts being exercised or assigned. These figures do not account for a portion of a multi-leg strategy being changed or removed or the trader assuming a short or long position in the underlying stock at or before expiration. Therefore, it is possible to lose more than the theoretical max loss of a strategy.
Moomoo is a financial information and trading app offered by Moomoo Technologies Inc. In the U.S., investment products and services on Moomoo are offered by Moomoo Financial Inc., Member FINRA/SIPC.
TradingView is an independent third party not affiliated with Moomoo Financial Inc., Moomoo Technologies Inc., or its affiliates. Moomoo Financial Inc. and its affiliates do not endorse, represent or warrant the completeness and accuracy of the data and information available on the TradingView platform and are not responsible for any services provided by the third-party platform.
Exención de responsabilidad
La información y las publicaciones que ofrecemos, no implican ni constituyen un asesoramiento financiero, ni de inversión, trading o cualquier otro tipo de consejo o recomendación emitida o respaldada por TradingView. Puede obtener información adicional en las Condiciones de uso.