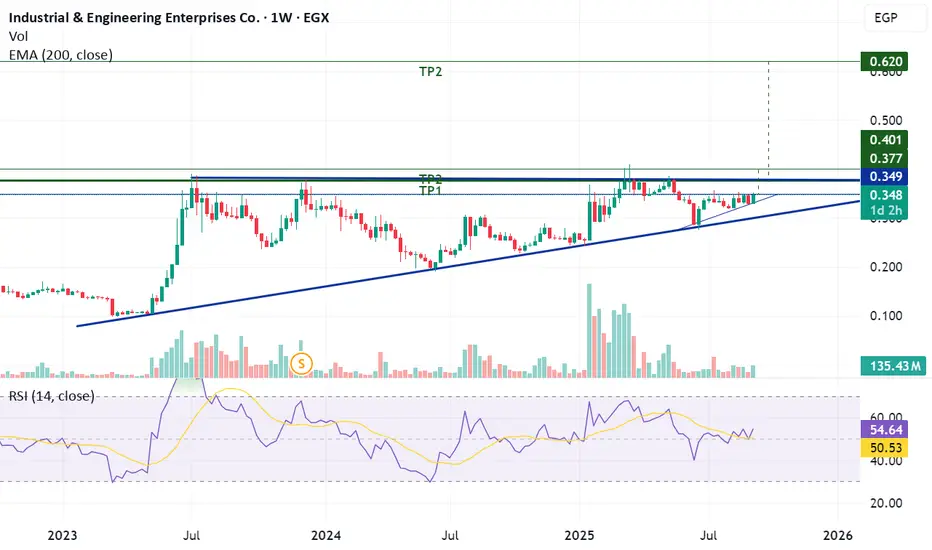
On the weekly chart, the stock is forming an ascending triangle. On the daily chart, it is also moving within a smaller ascending triangle.
- Short term: If the price breaks 0.35 and holds above it, targets are 0.378 – 0.40.
- Medium to long term: If the price stabilizes above 0.40, the target becomes 0.62 (measured target of the ascending triangle on the weekly chart).
⚠ Stop loss after confirming above 0.35: 0.33
Exención de responsabilidad
La información y las publicaciones no constituyen, ni deben considerarse como asesoramiento o recomendaciones financieras, de inversión, de trading o de otro tipo proporcionadas o respaldadas por TradingView. Más información en Condiciones de uso.
Exención de responsabilidad
La información y las publicaciones no constituyen, ni deben considerarse como asesoramiento o recomendaciones financieras, de inversión, de trading o de otro tipo proporcionadas o respaldadas por TradingView. Más información en Condiciones de uso.