Overview
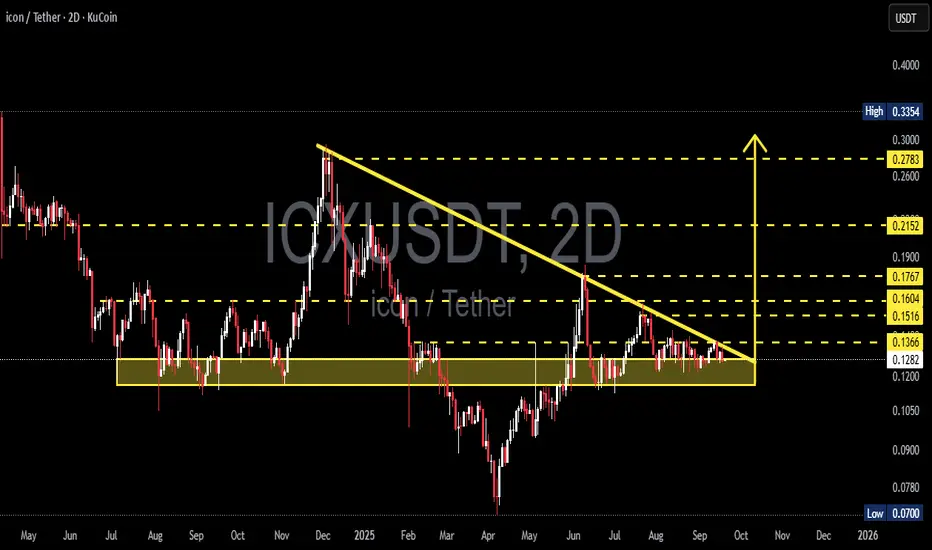
ICX is currently at a critical stage. Price has been consolidating for months within the strong demand zone at 0.11–0.13, while being consistently pressured by a descending trendline from late 2024 highs. This structure has formed a Descending Triangle / Compression pattern, where volatility is contracting, signaling that a major move is imminent.
The setup is classic: the longer the squeeze, the stronger the breakout when it comes. The question is — will ICX break to the upside or collapse below support?
---
Key Levels
Demand zone (major support): 0.11 – 0.13
Immediate resistance (trendline + horizontal): 0.1366
Upside resistance targets: 0.1516 → 0.1604 → 0.1767 → 0.2152 → 0.2783 → 0.3354
Breakdown targets: 0.09 → 0.07
---
Pattern Explanation
Descending Triangle: consistent lower highs (selling pressure) while buyers defend a flat support zone.
Statistically, this pattern leans bearish, but when it forms near a strong demand zone after a prolonged downtrend, it can also serve as a base for reversal.
ICX is now at the apex of the triangle → volatility has compressed and a breakout/breakdown is highly likely soon.
---
Bullish Scenario
Trigger: a 2D close above the descending trendline with rising volume.
Additional confirmation: successful retest of the breakout zone around 0.1366.
Upside targets:
TP1: 0.1516
TP2: 0.1604 – 0.1767
TP3: 0.2152
Extended: 0.2783 → 0.3354
Stop Loss: below demand zone (~0.105)
---
Bearish Scenario
Trigger: a 2D close below 0.11–0.105 with strong selling volume.
Downside targets:
Initial: 0.09
Extended: 0.07 (major chart low)
Stop Loss for shorts: reclaim above 0.13–0.1366
---
Sentiment & Momentum
Volume: currently declining, showing the market is waiting for a trigger before the next big move.
Momentum: RSI & MACD remain neutral, supporting the potential for a strong move once breakout occurs.
Market structure:
If support breaks → fast drop toward 0.09–0.07
If support holds → strong base for mid-term reversal
---
Conclusion
ICX is at a make-or-break point:
Bullish case: breakout above trendline could ignite a rally toward 0.15–0.21 and beyond.
Bearish case: breakdown below support opens the path to 0.09 or even 0.07.
Wait for 2D close with volume confirmation before entering. Manage risk properly — this is not the place to trade without discipline.
Not financial advice — purely technical analysis. DYOR & use risk management.
---
ICX/USDT is forming a Descending Triangle at the 0.11–0.13 demand zone.
Volatility is tightening → expect a major breakout or breakdown soon.
✅ Bullish: 2D close > trendline → targets 0.1516 / 0.1767 / 0.2152
❌ Bearish: 2D close < 0.105 → targets 0.09 / 0.07
Watch volume + 2D close for confirmation.
Trading without risk management = suicide.
---
#ICX #ICON #ICXUSDT #CryptoAnalysis #TechnicalAnalysis #DescendingTriangle #SupportResistance #Breakout
✅ Get Free Signals! Join Our Telegram Channel Here: t.me/TheCryptoNuclear
✅ Twitter: twitter.com/crypto_nuclear
✅ Join Bybit : partner.bybit.com/b/nuclearvip
✅ Benefits : Lifetime Trading Fee Discount -50%
✅ Twitter: twitter.com/crypto_nuclear
✅ Join Bybit : partner.bybit.com/b/nuclearvip
✅ Benefits : Lifetime Trading Fee Discount -50%
Exención de responsabilidad
La información y las publicaciones no constituyen, ni deben considerarse como asesoramiento o recomendaciones financieras, de inversión, de trading o de otro tipo proporcionadas o respaldadas por TradingView. Más información en Condiciones de uso.