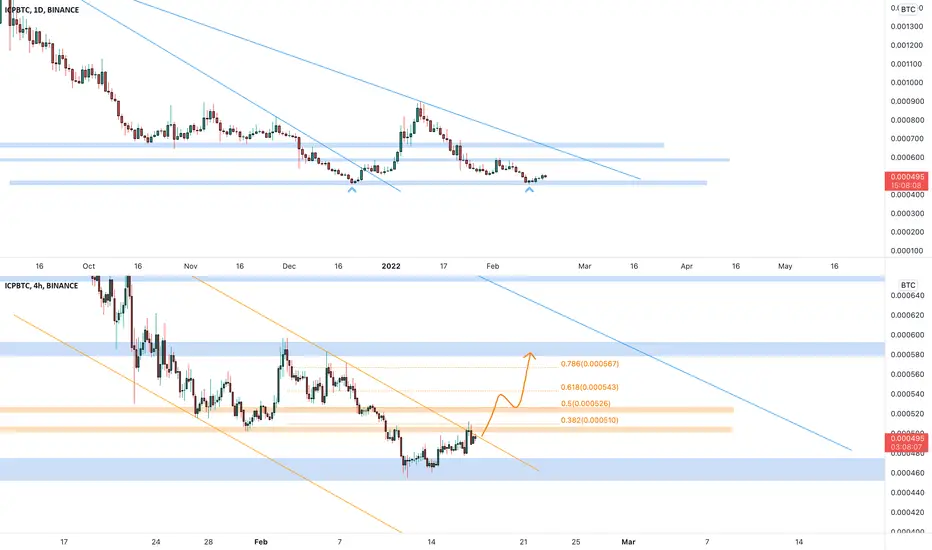
ICPBTC:The price is creating a double bottom on the daily timeframe on 0.000453 as you can see on the upper chart (daily timeframe)
On the 4h Timeframe, the price is testing a descending channel and the static resistance. Using the Fibonacci Retracement we can see that the price is testing the 0.382 Fibonacci level as well.
How to approach?
If the price is going to have a breakout from the descending channel with Volume, According to Plancton's strategy, we can set a nice order
–––––
Keep in mind.
–––––
Follow the Shrimp 🦐
On the 4h Timeframe, the price is testing a descending channel and the static resistance. Using the Fibonacci Retracement we can see that the price is testing the 0.382 Fibonacci level as well.
How to approach?
If the price is going to have a breakout from the descending channel with Volume, According to Plancton's strategy, we can set a nice order
–––––
Keep in mind.
- 🟣 Purple structure -> Monthly structure.
- 🔴 Red structure -> Weekly structure.
- 🔵 Blue structure -> Daily structure.
- 🟡 Yellow structure -> 4h structure.
–––––
Follow the Shrimp 🦐
Nota
The price is testing the 4h resistance after the breakout from the descending channel. We are waiting for a clear breakoutExención de responsabilidad
La información y las publicaciones que ofrecemos, no implican ni constituyen un asesoramiento financiero, ni de inversión, trading o cualquier otro tipo de consejo o recomendación emitida o respaldada por TradingView. Puede obtener información adicional en las Condiciones de uso.
Exención de responsabilidad
La información y las publicaciones que ofrecemos, no implican ni constituyen un asesoramiento financiero, ni de inversión, trading o cualquier otro tipo de consejo o recomendación emitida o respaldada por TradingView. Puede obtener información adicional en las Condiciones de uso.