Pattern Summary
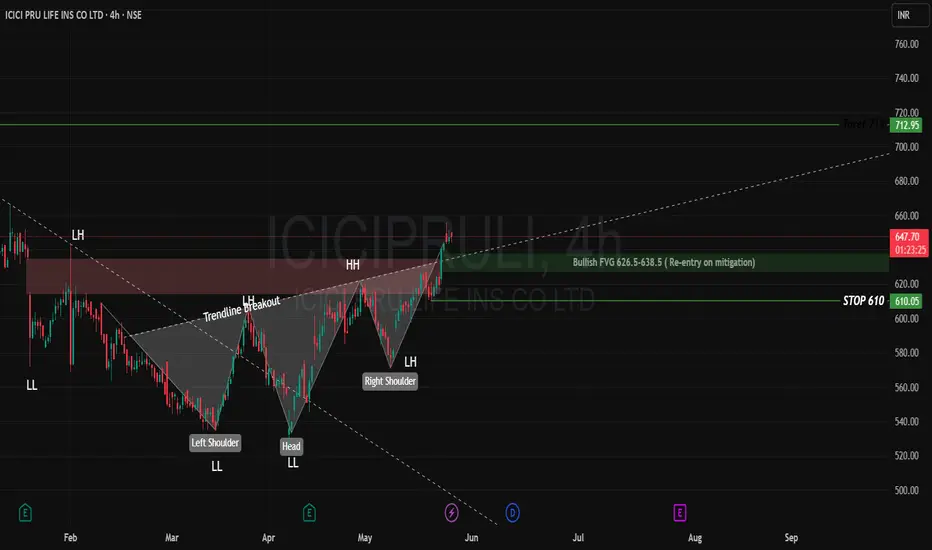
Inverse H&S Pattern
Trendline Breakout
Candlestick Insight: Inverted Hammer at CMP ₹647
Support Zones
Stop-loss Region: ₹610 (Below the neckline and structure support).
Disclaimer: lnkd.in/gJJDnvn2
Inverse H&S Pattern
- Left Shoulder: ₹535
- Head: ₹525
- Right Shoulder: ₹571
- Neckline/Breakout: ₹631 (Confirmed breakout zone)
- Target (Projected): ₹712 (Measured move aligns with pattern height)
Trendline Breakout
- Confirms bullish momentum post-H&S breakout.
- Price has cleared previous LH (Lower High) zones — trend bias shifting bullish.
Candlestick Insight: Inverted Hammer at CMP ₹647
- Appears after a rally, signals potential short-term exhaustion or pullback.
- Not a reversal on its own, but if followed by a red candle, can suggest short-term retracement.
- Occurs near resistance (~₹650) — caution for overbought levels in short term.
Support Zones
- Bullish Fair Value Gap (FVG): ₹626.5 – ₹638.5
- Re-entry opportunity upon mitigation (price retracing to fill the gap).
- Well-aligned with neckline retest (₹631) — a textbook retest-and-go scenario.
Stop-loss Region: ₹610 (Below the neckline and structure support).
Disclaimer: lnkd.in/gJJDnvn2
Exención de responsabilidad
La información y las publicaciones que ofrecemos, no implican ni constituyen un asesoramiento financiero, ni de inversión, trading o cualquier otro tipo de consejo o recomendación emitida o respaldada por TradingView. Puede obtener información adicional en las Condiciones de uso.