🔎 Overview
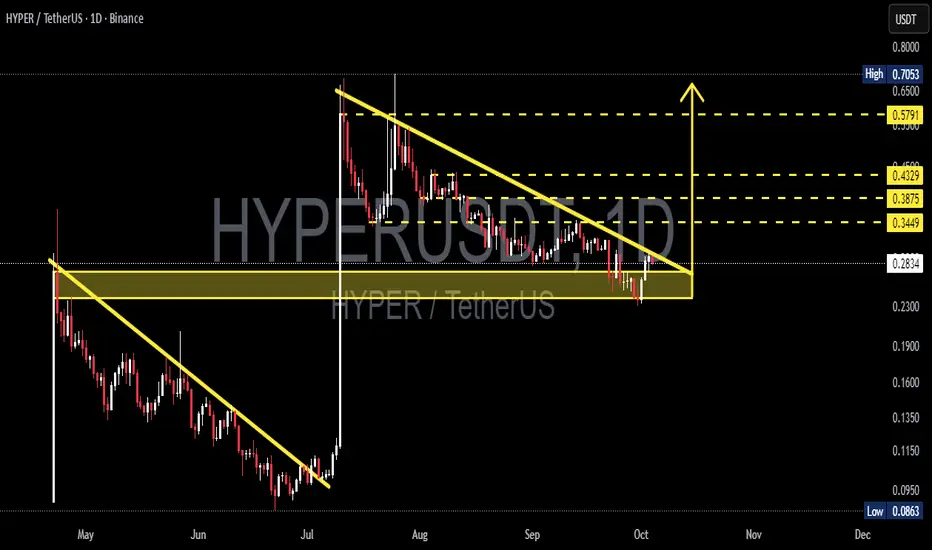
HYPER/USDT is currently trading inside a crucial consolidation zone (0.23–0.29 USDT) while being compressed by a descending trendline.
This setup forms a descending triangle pattern, typically a bearish continuation, but in some cases (especially after a strong rally), it can act as an accumulation phase before another bullish leg.
The market is now at a decision point — waiting for either a confirmed breakout to the upside or a breakdown below support.
---
📌 Pattern & Market Structure
Previous Trend: Strong pump in early July → followed by consolidation with selling pressure.
Main Pattern: Descending Triangle = flat horizontal support + descending trendline of lower highs.
Support Zone: 0.23 – 0.29 (highlighted yellow box on the chart).
Key Resistance Levels (if breakout occurs):
0.3449 → initial target
0.3875 → mid resistance
0.4329 → major resistance
0.5791 → extended target if momentum continues
Historical High/Low: High 0.7053 / Low 0.0863.
---
🚀 Bullish Scenario
1. Confirmation: A strong daily close above the descending trendline, ideally above 0.31.
2. Retest: Breakout gains strength if price retests the trendline and holds as new support.
3. Upside Targets:
TP1: 0.3449
TP2: 0.3875
TP3: 0.4329
TP4: 0.5791 (if rally extends)
4. Invalidation: A daily close below 0.23 invalidates the bullish setup.
---
🐻 Bearish Scenario
1. Confirmation: A daily close below 0.23 with strong volume confirms breakdown.
2. Downside Targets:
0.16 – 0.135 zone → historical support area
0.0863 → previous cycle low, major bearish target
3. Invalidation: If price reclaims and sustains above 0.34, the bearish outlook fails.
---
⚖️ Conclusion & Outlook
Neutral Zone: As long as price stays between 0.23 – 0.30, the market remains sideways without clear direction.
Bullish Outlook: Needs confirmation with daily close above trendline.
Bearish Outlook: Breakdown below 0.23 would shift momentum clearly bearish.
Best Strategy: Wait for confirmation on daily close & volume before entering, since descending triangles are prone to false breakouts.
---
📝 Notes for Traders
Apply strict risk management (1–2% risk per trade).
Take partial profits at each resistance level.
Focus on daily closes and volume spikes for confirmation, not intraday wicks.
---
#HYPERUSDT #Crypto #TechnicalAnalysis #Altcoin #PriceAction #ChartPattern #DescendingTriangle #Breakout #Bearish #Bullish #SupportResistance
✅ Get Free Signals! Join Our Telegram Channel Here: t.me/TheCryptoNuclear
✅ Twitter: twitter.com/crypto_nuclear
✅ Join Bybit : partner.bybit.com/b/nuclearvip
✅ Benefits : Lifetime Trading Fee Discount -50%
✅ Twitter: twitter.com/crypto_nuclear
✅ Join Bybit : partner.bybit.com/b/nuclearvip
✅ Benefits : Lifetime Trading Fee Discount -50%
Exención de responsabilidad
La información y las publicaciones que ofrecemos, no implican ni constituyen un asesoramiento financiero, ni de inversión, trading o cualquier otro tipo de consejo o recomendación emitida o respaldada por TradingView. Puede obtener información adicional en las Condiciones de uso.