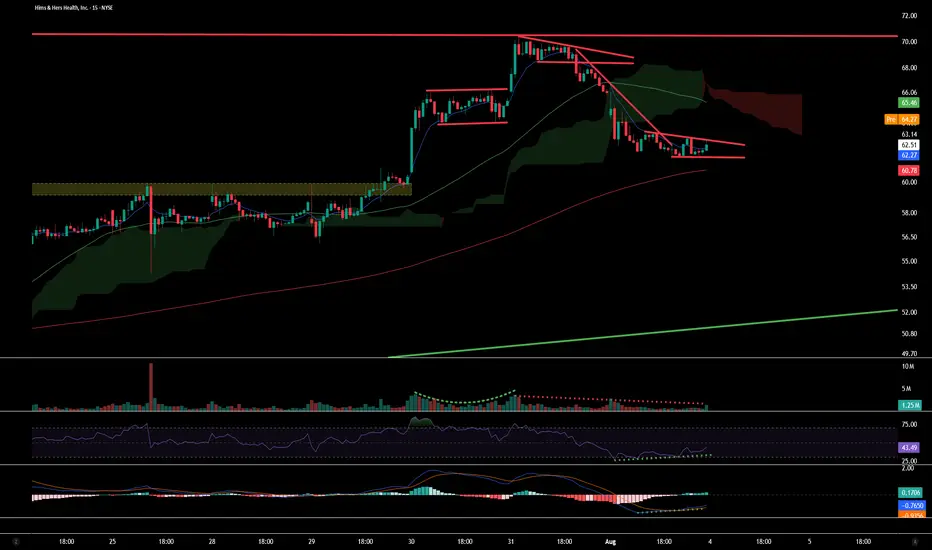
On the 15m Chart, you can see a bull flag and pennant form which broke down with confluence from MACD and RSI showing downside pressure. forming a bear pennant. However, both indicators are now flashing bullish divergence — price action is printing lower lows, while RSI and MACD are printing higher lows.
Premarket has broken above above the pennant, confirming the divergence.
Exención de responsabilidad
La información y las publicaciones que ofrecemos, no implican ni constituyen un asesoramiento financiero, ni de inversión, trading o cualquier otro tipo de consejo o recomendación emitida o respaldada por TradingView. Puede obtener información adicional en las Condiciones de uso.