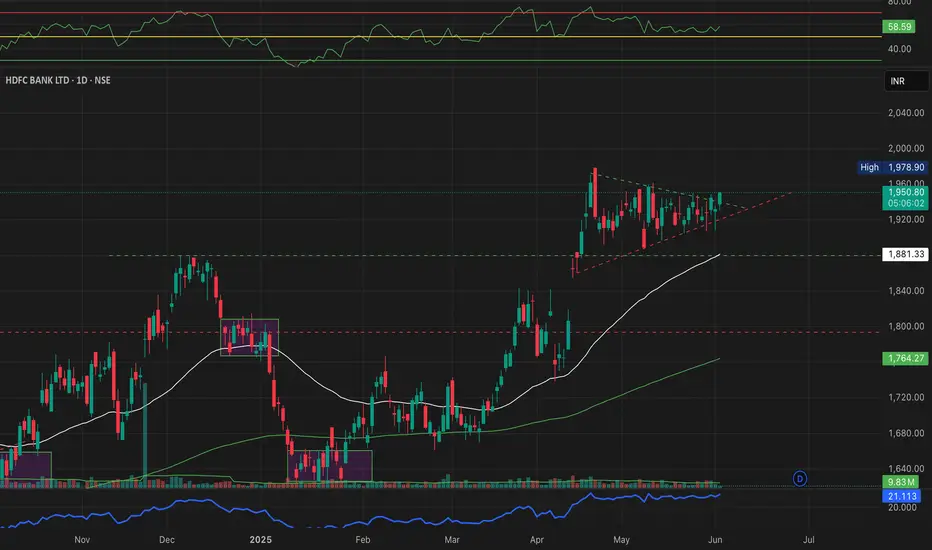
Symmetrical Triangle Tightening With Price Hovering Near Apex. Breakout Looks Imminent.
Price is also above 50 EMA, RSI around 56 - no extreme overbought zone, giving room for movement.
THIS LEVELS ARE PURELY BASED ON MANUAL PRICE ACTION - NO AUTO INDICATORS USED.
Will the triangle break upward or fakeout below? Let's Discuss in the comments!
All Levels hand - marked by Mayur Jayant Takalikar - based on clean structure & momentum zone spotting.
#HDFCBANK #PRICEACTION #TRADINGVIEWINDIA #CHARTANALYSIS #BREAKOUTSETUP #TRIANGLEPATTERN #SUPPORTRESISTANCE
Exención de responsabilidad
La información y las publicaciones no constituyen, ni deben considerarse como asesoramiento o recomendaciones financieras, de inversión, de trading o de otro tipo proporcionadas o respaldadas por TradingView. Más información en Condiciones de uso.
Exención de responsabilidad
La información y las publicaciones no constituyen, ni deben considerarse como asesoramiento o recomendaciones financieras, de inversión, de trading o de otro tipo proporcionadas o respaldadas por TradingView. Más información en Condiciones de uso.