Ticker: HCLTECH (NSE: HCLTECH)
Timeframe: 1D (Daily)
Overview:
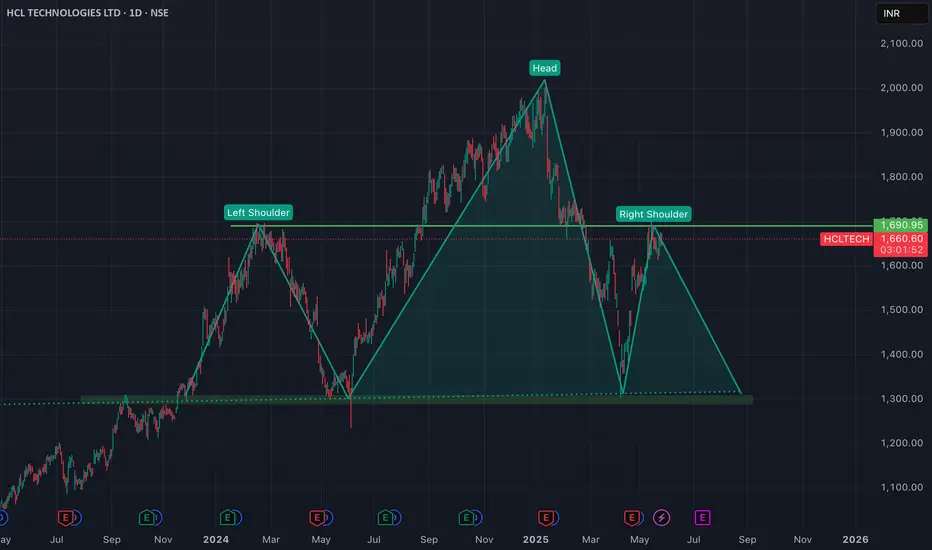
A potential Head and Shoulders (H&S) topping pattern appears to be forming on the daily chart of HCL Technologies. This classic reversal pattern, if confirmed, could signal a bearish trend reversal.
Key Observations (referencing the provided image):
Left Shoulder: The stock formed an initial peak around the 1,600 - 1,700 level in late 2023, subsequently pulling back.
Head: HCLTECH then rallied to form a higher peak (the "Head") around the 2,000 - 2,100 level in early 2024, followed by a significant decline.
Right Shoulder: Currently, the price seems to be forming the "Right Shoulder," with a rally attempting to reach similar levels as the Left Shoulder (around 1,600 - 1,700). However, it appears to be struggling to break higher.
Neckline: A clear neckline (marked by the green horizontal line in the image) can be drawn connecting the troughs between the shoulders and the head. This neckline is currently around the 1,300 - 1,350 level.
What to Watch For:
Neckline Break: The most critical confirmation for this H&S pattern would be a decisive daily close below the neckline (currently around 1,300 - 1,350) on increased volume.
Volume Confirmation: Look for higher volume during the decline from the right shoulder and a significant surge in volume upon a neckline break.
Target Calculation: If the pattern confirms, a potential downside target can be calculated by measuring the vertical distance from the peak of the Head to the Neckline and projecting that distance downwards from the point of the neckline break.
Potential Scenarios:
Bearish Confirmation: A break below the neckline would strongly suggest further downside movement, with the pattern's target being the primary objective.
Invalidation: The pattern would be invalidated if HCLTECH manages to break significantly above the peak of the Right Shoulder or the Head on strong volume, indicating renewed bullish momentum.
Disclaimer:
This is an idea based on technical analysis patterns and is not financial advice. Always conduct your own research and consider multiple factors before making any trading decisions. Past performance is not indicative of future results.
Timeframe: 1D (Daily)
Overview:
A potential Head and Shoulders (H&S) topping pattern appears to be forming on the daily chart of HCL Technologies. This classic reversal pattern, if confirmed, could signal a bearish trend reversal.
Key Observations (referencing the provided image):
Left Shoulder: The stock formed an initial peak around the 1,600 - 1,700 level in late 2023, subsequently pulling back.
Head: HCLTECH then rallied to form a higher peak (the "Head") around the 2,000 - 2,100 level in early 2024, followed by a significant decline.
Right Shoulder: Currently, the price seems to be forming the "Right Shoulder," with a rally attempting to reach similar levels as the Left Shoulder (around 1,600 - 1,700). However, it appears to be struggling to break higher.
Neckline: A clear neckline (marked by the green horizontal line in the image) can be drawn connecting the troughs between the shoulders and the head. This neckline is currently around the 1,300 - 1,350 level.
What to Watch For:
Neckline Break: The most critical confirmation for this H&S pattern would be a decisive daily close below the neckline (currently around 1,300 - 1,350) on increased volume.
Volume Confirmation: Look for higher volume during the decline from the right shoulder and a significant surge in volume upon a neckline break.
Target Calculation: If the pattern confirms, a potential downside target can be calculated by measuring the vertical distance from the peak of the Head to the Neckline and projecting that distance downwards from the point of the neckline break.
Potential Scenarios:
Bearish Confirmation: A break below the neckline would strongly suggest further downside movement, with the pattern's target being the primary objective.
Invalidation: The pattern would be invalidated if HCLTECH manages to break significantly above the peak of the Right Shoulder or the Head on strong volume, indicating renewed bullish momentum.
Disclaimer:
This is an idea based on technical analysis patterns and is not financial advice. Always conduct your own research and consider multiple factors before making any trading decisions. Past performance is not indicative of future results.
Exención de responsabilidad
La información y las publicaciones no constituyen, ni deben considerarse como asesoramiento o recomendaciones financieras, de inversión, de trading o de otro tipo proporcionadas o respaldadas por TradingView. Más información en Condiciones de uso.
Exención de responsabilidad
La información y las publicaciones no constituyen, ni deben considerarse como asesoramiento o recomendaciones financieras, de inversión, de trading o de otro tipo proporcionadas o respaldadas por TradingView. Más información en Condiciones de uso.