Hi dear patrons, hope you are well and welcome to the new update on The Graph (GRT).
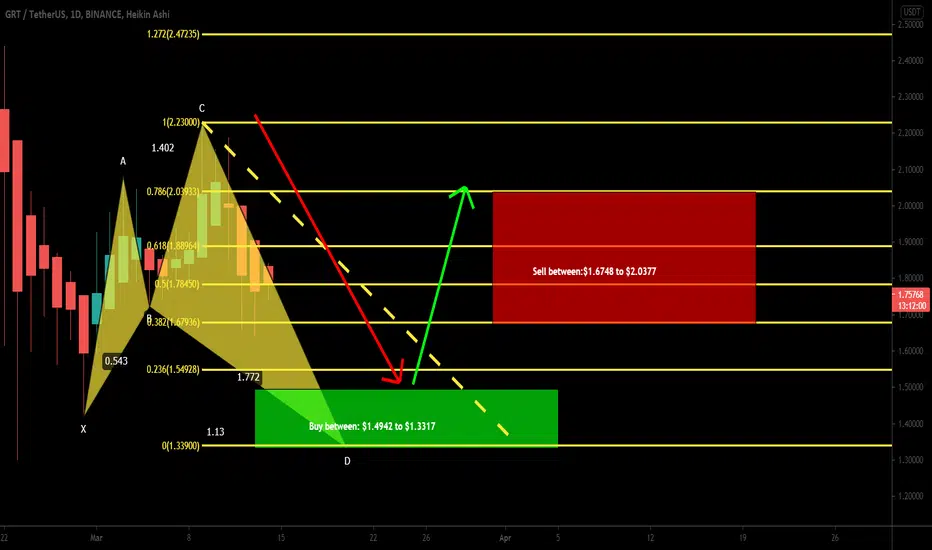
On the daily time period chart, the price action of the GRT is completing the last leg of the bullish Shark pattern and soon it will be entered the potential reversal zone.

Buying and sell targets for Shark move:
The buying and sell targets as per the Fibonacci sequence of the Shark pattern should be:
Buy between: $1.4942 to $1.3317
Sell between:$1.6748 to $2.0377
Stop loss:
The maximum extent of the potential reversal zone to $1.3317 can be used as stop loss.
Possible profit and loss ratio:
As per the above targets, this trade has a huge profit possibility of 53%,%, and the high loss possibility up to 11%.
Note: Above idea is for educational purpose only. It is advised to diversify and strictly follow the stop loss, and don't get stuck with trade.
On the daily time period chart, the price action of the GRT is completing the last leg of the bullish Shark pattern and soon it will be entered the potential reversal zone.
Buying and sell targets for Shark move:
The buying and sell targets as per the Fibonacci sequence of the Shark pattern should be:
Buy between: $1.4942 to $1.3317
Sell between:$1.6748 to $2.0377
Stop loss:
The maximum extent of the potential reversal zone to $1.3317 can be used as stop loss.
Possible profit and loss ratio:
As per the above targets, this trade has a huge profit possibility of 53%,%, and the high loss possibility up to 11%.
Note: Above idea is for educational purpose only. It is advised to diversify and strictly follow the stop loss, and don't get stuck with trade.
Exención de responsabilidad
La información y las publicaciones no constituyen, ni deben considerarse como asesoramiento o recomendaciones financieras, de inversión, de trading o de otro tipo proporcionadas o respaldadas por TradingView. Más información en Condiciones de uso.
Exención de responsabilidad
La información y las publicaciones no constituyen, ni deben considerarse como asesoramiento o recomendaciones financieras, de inversión, de trading o de otro tipo proporcionadas o respaldadas por TradingView. Más información en Condiciones de uso.