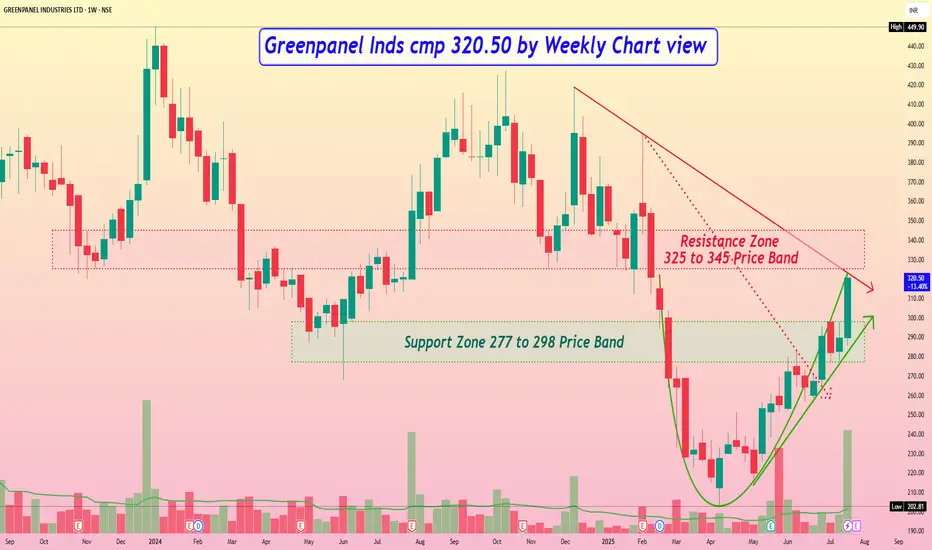
Greenpanel Inds cmp 320.50 by Weekly Chart view
- Support Zone 277 to 298 Price Band
- Resistance Zone 325 to 345 Price Band
- Bullish Rounding Bottom with Resistance Zone neckline
- Rising Support Trendline seems well respected by price momentum
- Volumes have surged very heavily over past week by demand based buying
- 1st Falling Resistance Trendline Brake out done and 2nd Trendline Breakout attempted
- Most common Technical Indicators like BB, EMA, MACD, RSI, SAR are showing positive trend
Exención de responsabilidad
La información y las publicaciones no constituyen, ni deben considerarse como asesoramiento o recomendaciones financieras, de inversión, de trading o de otro tipo proporcionadas o respaldadas por TradingView. Más información en Condiciones de uso.
Exención de responsabilidad
La información y las publicaciones no constituyen, ni deben considerarse como asesoramiento o recomendaciones financieras, de inversión, de trading o de otro tipo proporcionadas o respaldadas por TradingView. Más información en Condiciones de uso.