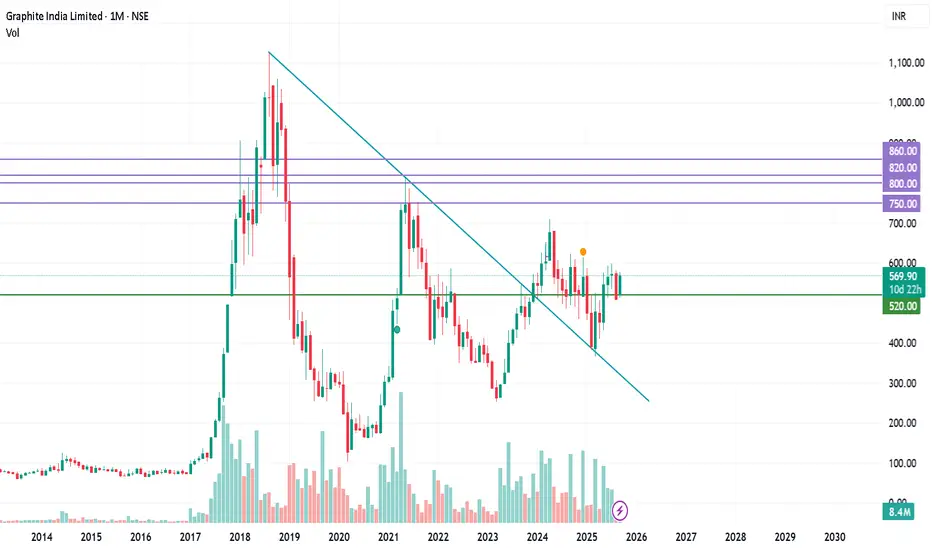
🔺 Descending Trendline Break
- The stock had been in a long-term downtrend since its 2018 peak, forming lower highs.
- Recently, it broke above the descending trendline, which is a classic bullish breakout signal.
- This suggests a potential trend reversal from bearish to bullish.
📈 Strong Monthly Candle
- The breakout candle has a wide range and strong close near the high, indicating conviction.
- Volume is elevated, confirming institutional participation.
🧠 Psychological Shift
- Breaking a multi-year trendline often reflects a change in market sentiment—from pessimism to optimism.
- Traders and investors may now start re-rating the stock, especially if fundamentals support it.
This is only for education purpose.
Exención de responsabilidad
La información y las publicaciones que ofrecemos, no implican ni constituyen un asesoramiento financiero, ni de inversión, trading o cualquier otro tipo de consejo o recomendación emitida o respaldada por TradingView. Puede obtener información adicional en las Condiciones de uso.