Gold with technical analysis and its key support and resistance
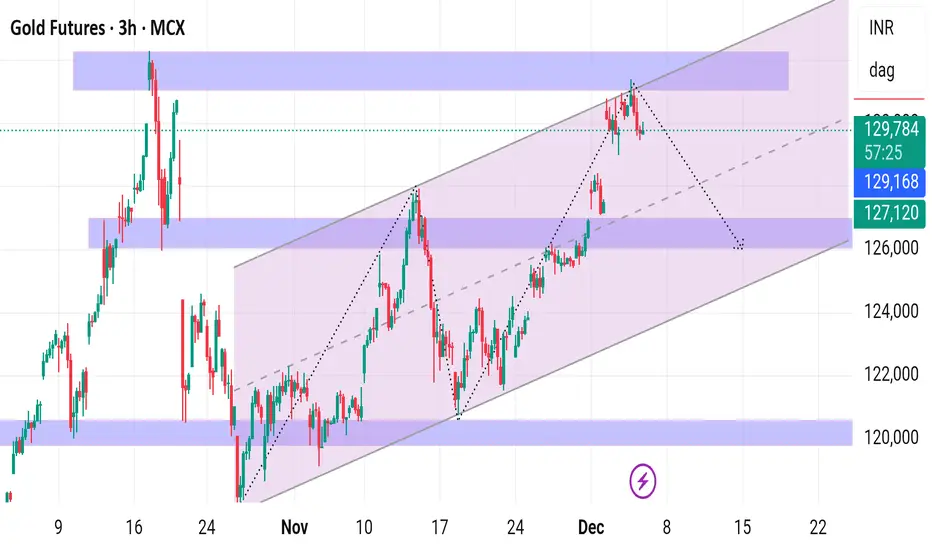
Gold is in a rising parallel channel on the 3‑hour chart, currently reacting lower from the upper boundary, so short‑term bias is for a pullback within an overall uptrend.
Key levels to watch are supports near 129,175–127,120 and resistance around 131,200–131,500 and the channel top.
## Trend structure
- Price has been respecting a well‑defined ascending channel since early November, with higher highs and higher lows confirming an uptrend on this timeframe.
- The latest swing has reached the upper band of this channel and shows rejection candles, indicating supply pressure and possible short‑term exhaustion of buyers.
## Support zones
- Immediate intraday support is near the mid‑channel and prior breakout area around 129,100–129,200; a hold here keeps the uptrend structure intact.
- Deeper support sits at 127,100–127,200, aligning with the channel lower boundary and previous demand zone; a sustained break below this area would signal a potential trend change or larger correction towards 125,000 and then 122,000.
## Resistance zones
- The first and most important resistance is the recent high and channel top region near 131,200–131,500, where repeated rejections suggest strong sellers.
- If price can close firmly above this band, the channel’s upper projection opens room for further upside, with next resistance coming from measured channel extension and recent technical levels around 133,000–133,500.
## Trading view
- As long as price stays inside the rising channel and above 127,100–127,200, the primary trend remains bullish and dips into support can be treated as buy‑on‑dip opportunities with tight risk control.
- A breakdown below the lower channel with volume would favor a shift to sell‑on‑rise, targeting the lower horizontal supports mentioned, while any fresh breakout above 131,500 would invalidate the short‑term bearish pullback idea and resume the up‑leg.
Exención de responsabilidad
La información y las publicaciones no constituyen, ni deben considerarse como asesoramiento o recomendaciones financieras, de inversión, de trading o de otro tipo proporcionadas o respaldadas por TradingView. Más información en Condiciones de uso.
Exención de responsabilidad
La información y las publicaciones no constituyen, ni deben considerarse como asesoramiento o recomendaciones financieras, de inversión, de trading o de otro tipo proporcionadas o respaldadas por TradingView. Más información en Condiciones de uso.