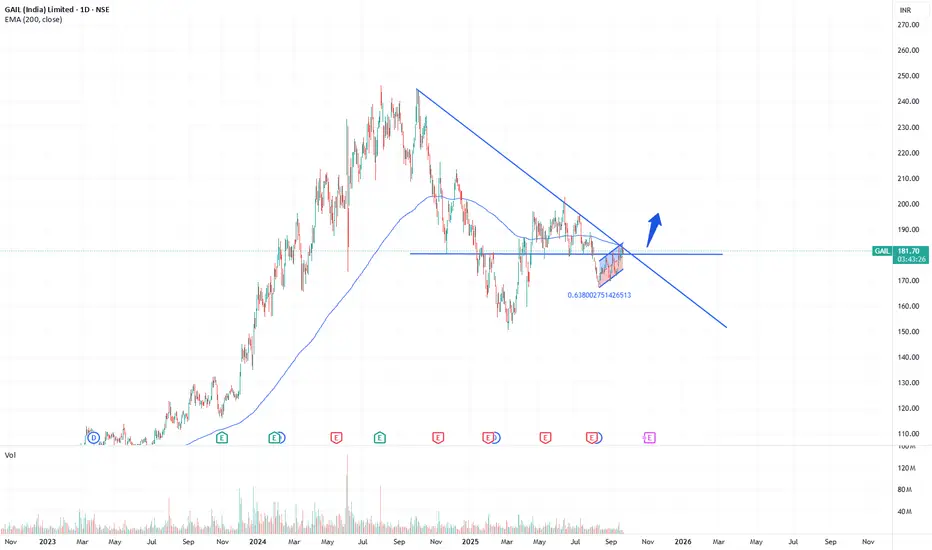
Trendline Break: Price is currently testing the long-term descending trendline near 182–185. Watching whether it sustains above this zone or reacts lower. This will be the first sign of buyers regaining control.
Channel Formation: Price is moving inside a rising channel. A move outside this channel will indicate the next direction — either strength if it breaks higher, or weakness if it breaks lower.
Horizontal Level: The 180 neckline has been tested multiple times and is acting as a strong support. Price is currently trading just above this level.
Indicators:
Disclaimer: This is for educational purposes only and not investment advice. I am not a SEBI registered advisor.
Channel Formation: Price is moving inside a rising channel. A move outside this channel will indicate the next direction — either strength if it breaks higher, or weakness if it breaks lower.
Horizontal Level: The 180 neckline has been tested multiple times and is acting as a strong support. Price is currently trading just above this level.
Indicators:
- RSI (60.7): Momentum is in the bullish zone but not overbought.
- MACD: Just crossed into positive territory, showing early signs of strength.
- EMA 200 (181.9): Price is right at the 200 EMA. Sustaining above it would be a positive sign.
Disclaimer: This is for educational purposes only and not investment advice. I am not a SEBI registered advisor.
Exención de responsabilidad
La información y las publicaciones no pretenden ser, ni constituyen, asesoramiento o recomendaciones financieras, de inversión, de trading o de otro tipo proporcionadas o respaldadas por TradingView. Más información en Condiciones de uso.
Exención de responsabilidad
La información y las publicaciones no pretenden ser, ni constituyen, asesoramiento o recomendaciones financieras, de inversión, de trading o de otro tipo proporcionadas o respaldadas por TradingView. Más información en Condiciones de uso.