📊 The Technical Take
The charts show a classic standoff between long-term strength and short-term indecision!
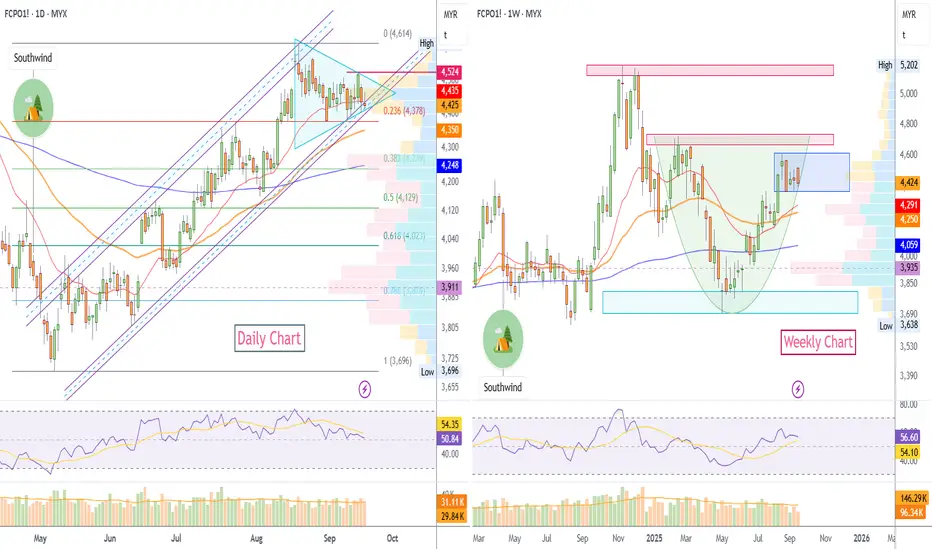
📈 Long-Term Bullish: The big picture (weekly chart) shows a powerful **"Cup and Handle"** pattern forming. This is a very strong bullish sign for the months ahead! ☕️
🧘 Short-Term Pause: The daily chart shows the price is coiling tightly in a "Symmetrical Triangle"
🔺 The market is taking a breather and building energy for its next big move.
🌍 The Fundamental Story
It's a classic tug-of-war between strong demand and rising supply.
🟢 THE BULLS (Demand):
🟢 India's Unstoppable Demand: India 🇮🇳 is currently the powerhouse driver of the market. Imports surged by over 15% in August to a 13-month high! This is fueled by massive restocking for their festive season and palm oil's significant price advantage over competing oils. This strong demand is expected to continue, absorbing any new supply.
💰 Good Price: Palm oil's price advantage over soyoil is keeping buyers interested.
💧 The Biodiesel Boost: Don't forget the structural demand! Government mandates in both Indonesia and Malaysia for higher biofuel blending (B40) are permanently removing millions of tons of palm oil from the food market, creating a tighter long-term supply balance that is very supportive of higher prices.
🌏 Strong Global Exports: Beyond India, overall export numbers from Malaysia have been improving, showing that global demand remains robust and is successfully absorbing the seasonal increase in production.
🔴 THE BEARS (Supply):
- 🌿Harvest Pressure: It's peak production season in Malaysia & Indonesia, meaning more supply is hitting the market.
- 📦 Stocks are Up: Inventories in Malaysia are at a 2-year high.
👀 Outlook for the Week Ahead
The market is perfectly balanced and waiting for a catalyst. The key is to watch the symmetrical triangle on the daily chart!
🎯 Bullish Scenario: A breakout **ABOVE** the triangle signals that strong demand is winning. This could kick off the next leg up!
⚠️ Bearish Scenario: A breakdown **BELOW** the triangle would mean that supply pressure is taking over, and we could see a deeper price correction.
In short: The market is coiled like a spring. Watch for the breakout to see which way it pops! 🚀
The charts show a classic standoff between long-term strength and short-term indecision!
📈 Long-Term Bullish: The big picture (weekly chart) shows a powerful **"Cup and Handle"** pattern forming. This is a very strong bullish sign for the months ahead! ☕️
🧘 Short-Term Pause: The daily chart shows the price is coiling tightly in a "Symmetrical Triangle"
🔺 The market is taking a breather and building energy for its next big move.
🌍 The Fundamental Story
It's a classic tug-of-war between strong demand and rising supply.
🟢 THE BULLS (Demand):
🟢 India's Unstoppable Demand: India 🇮🇳 is currently the powerhouse driver of the market. Imports surged by over 15% in August to a 13-month high! This is fueled by massive restocking for their festive season and palm oil's significant price advantage over competing oils. This strong demand is expected to continue, absorbing any new supply.
💰 Good Price: Palm oil's price advantage over soyoil is keeping buyers interested.
💧 The Biodiesel Boost: Don't forget the structural demand! Government mandates in both Indonesia and Malaysia for higher biofuel blending (B40) are permanently removing millions of tons of palm oil from the food market, creating a tighter long-term supply balance that is very supportive of higher prices.
🌏 Strong Global Exports: Beyond India, overall export numbers from Malaysia have been improving, showing that global demand remains robust and is successfully absorbing the seasonal increase in production.
🔴 THE BEARS (Supply):
- 🌿Harvest Pressure: It's peak production season in Malaysia & Indonesia, meaning more supply is hitting the market.
- 📦 Stocks are Up: Inventories in Malaysia are at a 2-year high.
👀 Outlook for the Week Ahead
The market is perfectly balanced and waiting for a catalyst. The key is to watch the symmetrical triangle on the daily chart!
🎯 Bullish Scenario: A breakout **ABOVE** the triangle signals that strong demand is winning. This could kick off the next leg up!
⚠️ Bearish Scenario: A breakdown **BELOW** the triangle would mean that supply pressure is taking over, and we could see a deeper price correction.
In short: The market is coiled like a spring. Watch for the breakout to see which way it pops! 🚀
Exención de responsabilidad
La información y las publicaciones que ofrecemos, no implican ni constituyen un asesoramiento financiero, ni de inversión, trading o cualquier otro tipo de consejo o recomendación emitida o respaldada por TradingView. Puede obtener información adicional en las Condiciones de uso.