🔍 Technical Context
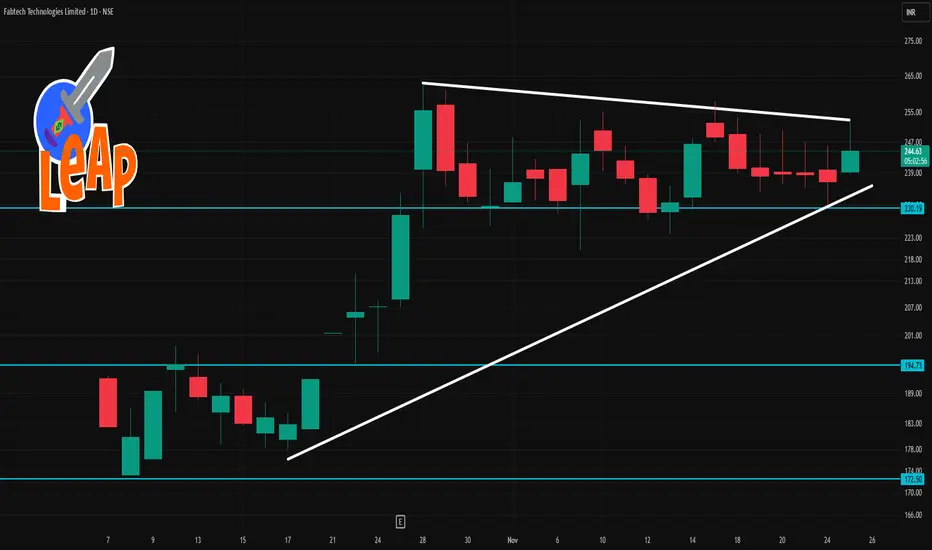
Moving averages (20-day, 50-day) are showing price above them, which suggests bullish bias.
Oscillators: RSI ~ 59-60 meaning moderate strength.
A recent source says the daily summary is “Neutral” on investing.com, indicating caution.
1-day pivot levels (classic) from Investing.com:
Pivot ~ ₹ 237.73
Resistance R1 ~ ₹ 240.46, R2 ~ ₹ 244.72, R3 ~ ₹ 247.45
Support S1 ~ ₹ 233.47, S2 ~ ₹ 230.74, S3 ~ ₹ 226.48
📊 Key Levels to Watch Today
Support Zone: ~ ₹ 233-235
If the stock approaches or dips into this area, watch for whether it holds or breaks.
Immediate Pivot / Mid-range: ~ ₹ 237-238
The pivot (~₹237.73) is a critical inflection point. A clear move above might bias upside; a break below may shift focus downward.
Resistance Zone: ~ ₹ 240-245
Upper resistance around ~₹240.46 to ~₹244.72. If momentum picks up and this zone is breached, next upside target ~₹247.45.
Lower Breakdown Level: ~ ₹ 230-227
If support in the ~233-235 zone fails, look toward ~₹230.74 and then ~₹226.48 as next real support.
Publicaciones relacionadas
Exención de responsabilidad
The information and publications are not meant to be, and do not constitute, financial, investment, trading, or other types of advice or recommendations supplied or endorsed by TradingView. Read more in the Terms of Use.
Publicaciones relacionadas
Exención de responsabilidad
The information and publications are not meant to be, and do not constitute, financial, investment, trading, or other types of advice or recommendations supplied or endorsed by TradingView. Read more in the Terms of Use.