Exide Industries - Technical Analysis Overview
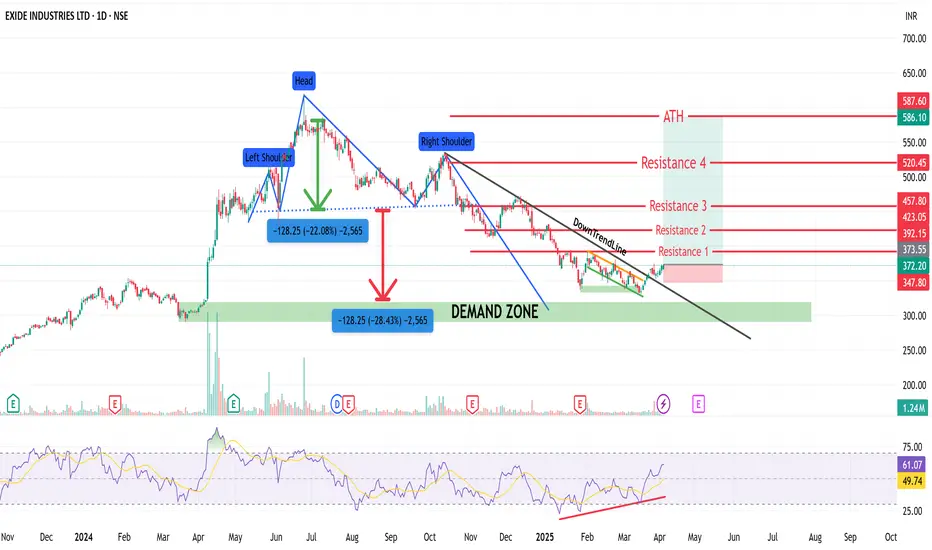
The chart shows a classic Head and Shoulders pattern, confirming a bearish reversal that played out with a 22–28% fall.
Price eventually entered a strong Demand Zone (₹310–₹335), where buying interest emerged, halting the downtrend.
A Falling Wedge breakout has occurred — a powerful bullish reversal signal — supported by increasing volume, indicating accumulation.
At the bottom, Bullish RSI Divergence is clearly visible — RSI formed higher lows while price made lower lows, signaling momentum shift.
The RSI has now crossed 61, indicating growing bullish strength.
Price has reclaimed key levels and is now approaching multiple resistance zones:
R1: ₹373.55
R2: ₹392.15
R3: ₹423.05 / ₹457.80
R4: ₹520.45
ATH: ₹586.10 / ₹587.60
📊 Inference:
The stock has respected structure perfectly — from pattern breakdown, bounce at demand, and now wedge breakout.
Sustaining above ₹373.55 could trigger further rallies toward ₹392–423 and eventually ₹457–520 if momentum holds.
Long-term breakout above ₹587 would signal fresh highs and trend continuation.
Exención de responsabilidad
La información y las publicaciones que ofrecemos, no implican ni constituyen un asesoramiento financiero, ni de inversión, trading o cualquier otro tipo de consejo o recomendación emitida o respaldada por TradingView. Puede obtener información adicional en las Condiciones de uso.