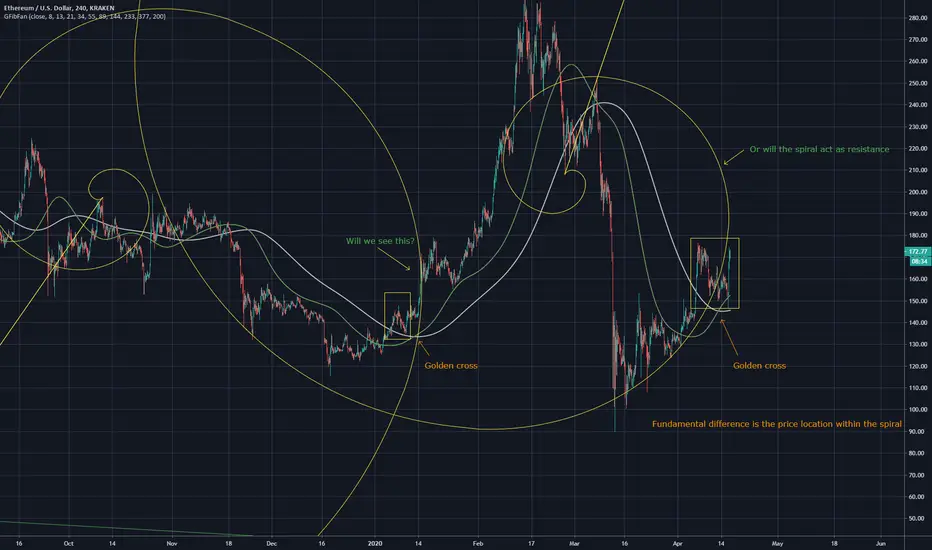
Comparison of two similar points on Ethereum
The previous golden cross produced a run that was on the INSIDE of the fibonacci spiral
While this golden cross is on the outside of the fib spiral, will this repeat? Or will it act as a resistance

Here is my bottoms chart for Ethereum showing bottom points and potential future bottoms
The previous golden cross produced a run that was on the INSIDE of the fibonacci spiral
While this golden cross is on the outside of the fib spiral, will this repeat? Or will it act as a resistance
Here is my bottoms chart for Ethereum showing bottom points and potential future bottoms
Exención de responsabilidad
La información y las publicaciones que ofrecemos, no implican ni constituyen un asesoramiento financiero, ni de inversión, trading o cualquier otro tipo de consejo o recomendación emitida o respaldada por TradingView. Puede obtener información adicional en las Condiciones de uso.