September 4th - 7:15pm
In today's daily trade plan, I said - "Ideally, we lose 6454, flush and reclaim for a move higher. I expect another choppy day, and we need to clear 6491 to keep this rally moving higher."
At 10:16am price dropped down to 6456.25 and took off higher. You can look at a 4hr chart and see the institutional accumulation that has been happening. You can look at my weekly trading plan in which I stated -
"I do believe we can still rally up to 6547, 6563+ this week, but IF, we lose the 6369 level, that would be a big blow to bulls, and it would need to be sharp reclaim back inside the white trendline to keep momentum."
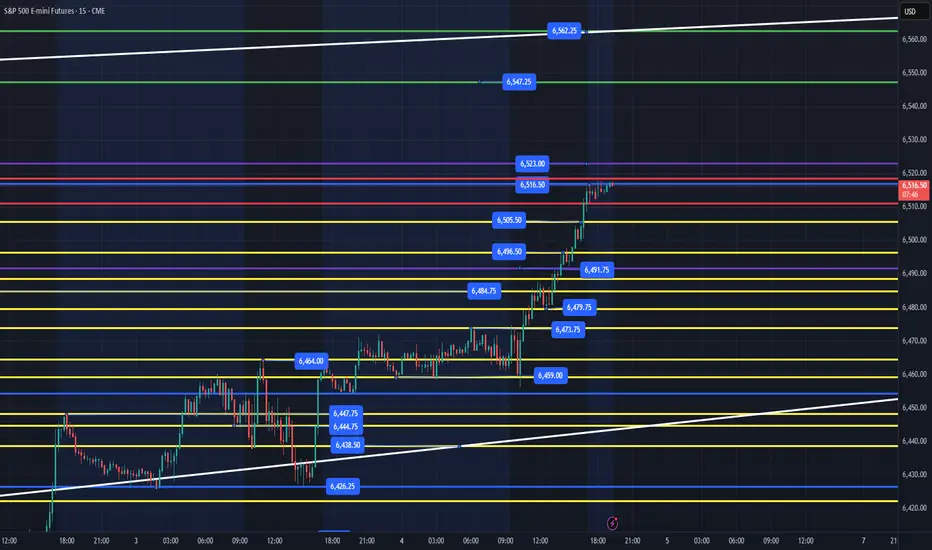
What did institutions do so far this week? Flush the white trendline, run stops, accumulate and we are heading higher. 6523 is the next big resistance with 6547, 6563 still in play. Price needs to hold 6473 with 6455 being the lowest for us to keep moving higher. Employment report out tomorrow am and usually the initial move will be a fake out. I don't trade prior to the employment report and usually wait until after the NYSE open to evaluate and find a spot to get some points. Since we have closed at highs on the day and we are just going sideways, the best levels that I will be looking for a flush and reclaim would be the 6491 level as it was the high of this week during the Sunday evening session. We could dip down to 6473/79 levels and then rally.
My lean is we grind sideways and up into the 6523 level overnight and then we will need to wait for the employment report and NYSE to try and get some level losses and reclaims to finish the week at our targets of 6547, 6563+.
I will post an updated chart tomorrow before 7am EST.
---------------------------------------------------------------------------------------------------------
Couple of things about how I color code my levels.
1. Purple shows the weekly High/Low
2. Red shows the current overnight session High/Low (New chart out in am)
3. Blue shows the previous day's session High/Low
4. Yellow Levels are levels that show support and resistance levels of interest.
5. White shows the trendline from the August lows.
In today's daily trade plan, I said - "Ideally, we lose 6454, flush and reclaim for a move higher. I expect another choppy day, and we need to clear 6491 to keep this rally moving higher."
At 10:16am price dropped down to 6456.25 and took off higher. You can look at a 4hr chart and see the institutional accumulation that has been happening. You can look at my weekly trading plan in which I stated -
"I do believe we can still rally up to 6547, 6563+ this week, but IF, we lose the 6369 level, that would be a big blow to bulls, and it would need to be sharp reclaim back inside the white trendline to keep momentum."
What did institutions do so far this week? Flush the white trendline, run stops, accumulate and we are heading higher. 6523 is the next big resistance with 6547, 6563 still in play. Price needs to hold 6473 with 6455 being the lowest for us to keep moving higher. Employment report out tomorrow am and usually the initial move will be a fake out. I don't trade prior to the employment report and usually wait until after the NYSE open to evaluate and find a spot to get some points. Since we have closed at highs on the day and we are just going sideways, the best levels that I will be looking for a flush and reclaim would be the 6491 level as it was the high of this week during the Sunday evening session. We could dip down to 6473/79 levels and then rally.
My lean is we grind sideways and up into the 6523 level overnight and then we will need to wait for the employment report and NYSE to try and get some level losses and reclaims to finish the week at our targets of 6547, 6563+.
I will post an updated chart tomorrow before 7am EST.
---------------------------------------------------------------------------------------------------------
Couple of things about how I color code my levels.
1. Purple shows the weekly High/Low
2. Red shows the current overnight session High/Low (New chart out in am)
3. Blue shows the previous day's session High/Low
4. Yellow Levels are levels that show support and resistance levels of interest.
5. White shows the trendline from the August lows.
Publicaciones relacionadas
Exención de responsabilidad
La información y las publicaciones que ofrecemos, no implican ni constituyen un asesoramiento financiero, ni de inversión, trading o cualquier otro tipo de consejo o recomendación emitida o respaldada por TradingView. Puede obtener información adicional en las Condiciones de uso.