Dynamatic Technologies Limited (DYNAMATECH) is trading in a strong uptrend near the upper end of its yearly range, but with stretched valuations and signs of momentum fatigue, so it suits disciplined, trend-following trades with tight risk rather than fresh aggressive entries.
## Price zone and trend
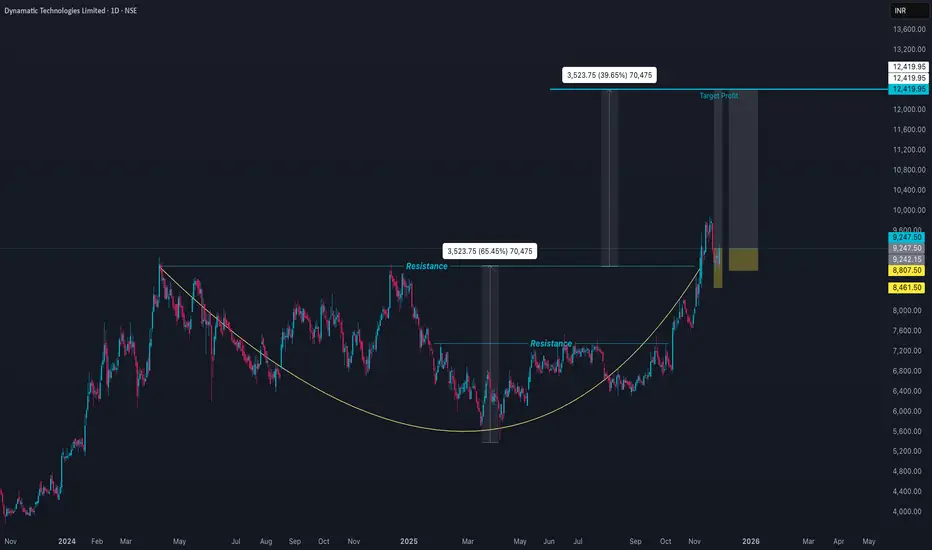
- Recent closes are around ₹9,100–9,300, after hitting a 52-week and all‑time high near ₹9,850 in November 2025, versus a 52‑week low near ₹5,440, which means price is holding in the top band of its yearly range and has already delivered strong multi‑month returns.
- Medium- to long-term structure remains bullish, with price above 50-, 100-, and 200-day moving averages on most analyses, indicating an established uptrend despite recent sideways-to-slightly corrective moves.
## Momentum and valuation
- RSI sits in the mid-30s, reflecting cooling momentum after the recent high rather than a full breakdown, while indicators like MACD lean short-term bearish even as ADX stays strong, a typical “trending but pausing” setup.[2][3]
- Valuation is rich, with trailing P/E well above 100x in some snapshots, signaling that a lot of future growth is already priced in and any earnings disappointment or macro shock could trigger sharp mean reversion.
## Key levels and trading view
- Immediate support lies in the ₹8,700–8,800 zone (recent swing and day’s low cluster), with deeper support toward ₹7,600 if correction extends, while resistance is around ₹9,800–9,900 and then psychological ₹10,000.
- For tactical trading, higher-probability setups are:
- Buying on dips toward support with confirmation (strong intraday rejection or volume pickup), targeting retests of the highs, and using tight stops just below the support band.
- Avoiding fresh longs on straight breakouts after vertical runs unless accompanied by clear volume expansion, and being cautious with shorts given the still-bullish higher timeframe trend and relatively low beta.
## Price zone and trend
- Recent closes are around ₹9,100–9,300, after hitting a 52-week and all‑time high near ₹9,850 in November 2025, versus a 52‑week low near ₹5,440, which means price is holding in the top band of its yearly range and has already delivered strong multi‑month returns.
- Medium- to long-term structure remains bullish, with price above 50-, 100-, and 200-day moving averages on most analyses, indicating an established uptrend despite recent sideways-to-slightly corrective moves.
## Momentum and valuation
- RSI sits in the mid-30s, reflecting cooling momentum after the recent high rather than a full breakdown, while indicators like MACD lean short-term bearish even as ADX stays strong, a typical “trending but pausing” setup.[2][3]
- Valuation is rich, with trailing P/E well above 100x in some snapshots, signaling that a lot of future growth is already priced in and any earnings disappointment or macro shock could trigger sharp mean reversion.
## Key levels and trading view
- Immediate support lies in the ₹8,700–8,800 zone (recent swing and day’s low cluster), with deeper support toward ₹7,600 if correction extends, while resistance is around ₹9,800–9,900 and then psychological ₹10,000.
- For tactical trading, higher-probability setups are:
- Buying on dips toward support with confirmation (strong intraday rejection or volume pickup), targeting retests of the highs, and using tight stops just below the support band.
- Avoiding fresh longs on straight breakouts after vertical runs unless accompanied by clear volume expansion, and being cautious with shorts given the still-bullish higher timeframe trend and relatively low beta.
Exención de responsabilidad
La información y las publicaciones no constituyen, ni deben considerarse como asesoramiento o recomendaciones financieras, de inversión, de trading o de otro tipo proporcionadas o respaldadas por TradingView. Más información en Condiciones de uso.
Exención de responsabilidad
La información y las publicaciones no constituyen, ni deben considerarse como asesoramiento o recomendaciones financieras, de inversión, de trading o de otro tipo proporcionadas o respaldadas por TradingView. Más información en Condiciones de uso.