Full Analysis:
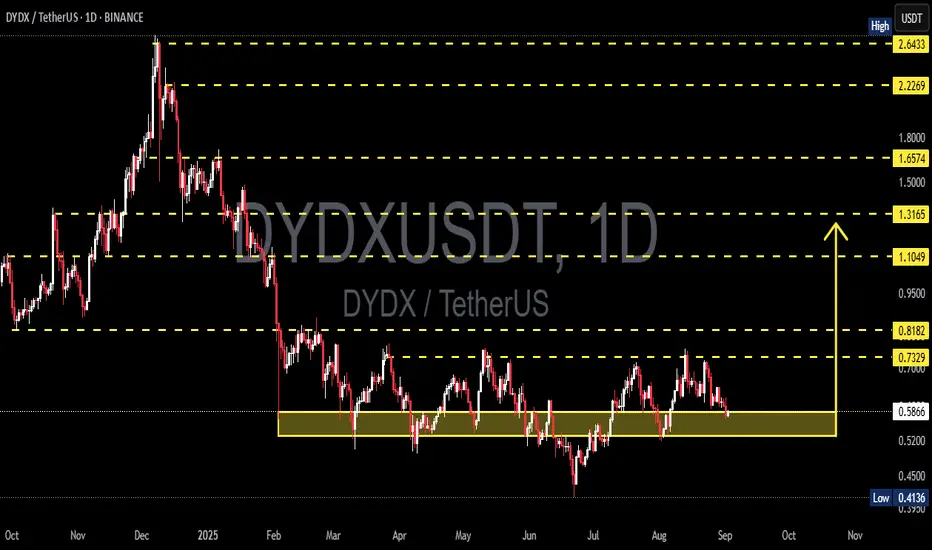
DYDX is currently standing at a critical decision point. The chart shows price retesting the demand zone $0.50–$0.59 (yellow box), which has acted as strong support multiple times since March, June, and August 2025. This zone remains the last stronghold before price revisits the previous low at $0.41.
On the macro view, DYDX is still in a downtrend since the peak at $2.64 (Dec 2024). However, in the mid-term, price is moving sideways inside a broad range of $0.41–$0.82, suggesting accumulation or consolidation before the next major directional move.
---
🔹 Bullish Scenario
If the $0.50–$0.59 zone holds once again, a strong rebound is possible.
Early confirmation: a daily close above $0.64–$0.68, showing buyer rejection at the demand area.
Next resistance targets: $0.73 (range high) → if broken, extension targets are $0.82 → $1.10 → $1.31.
Additional bullish signals: long lower wick candles around support, increasing buy volume, and formation of higher lows.
📈 Swing strategy (bullish): accumulate around $0.52–$0.59, stop-loss below $0.48, profit targets at $0.73–$0.82.
---
🔻 Bearish Scenario
If price fails and closes daily below $0.50, a confirmed breakdown is in play.
Downside targets: $0.41 (previous low), with further bearish continuation possible if that level breaks.
Breakdown of this zone will confirm a continuation of the macro downtrend, likely forming new lower lows.
Additional bearish confirmations: strong daily close below $0.50, heavy sell volume, repeated lower highs pattern.
📉 Swing strategy (bearish): short after breakdown & failed retest of $0.50–$0.52, stop-loss above $0.60, first target $0.41.
---
🔍 Pattern & Market Structure
Range-bound: DYDX has been consolidating within $0.41–$0.82 for months.
Demand Zone in Play: The $0.50–$0.59 zone has been tested three times — each test weakens it, but also increases chances of a strong bounce if buyers step in.
Decision Point: Price action here will decide whether DYDX forms a base for reversal or continues its macro bearish trend.
---
📌 Conclusion
DYDX is testing a critical historical support at $0.50–$0.59. Holding this zone could spark a rebound toward $0.73–$0.82, but a confirmed breakdown below $0.50 would likely extend the bearish trend toward $0.41.
Traders should wait for daily close confirmation before committing, as this area is the true “battle zone” between bulls and bears.
⚠️ Disclaimer: This analysis is not financial advice. Always manage risk and use stop-loss according to your strategy.
#DYDX #DYDXUSDT #Crypto #Altcoins #TechnicalAnalysis #SwingTrading #SupportResistance #PriceAction
✅ Get Free Signals! Join Our Telegram Channel Here: t.me/TheCryptoNuclear
✅ Twitter: twitter.com/crypto_nuclear
✅ Join Bybit : partner.bybit.com/b/nuclearvip
✅ Benefits : Lifetime Trading Fee Discount -50%
✅ Twitter: twitter.com/crypto_nuclear
✅ Join Bybit : partner.bybit.com/b/nuclearvip
✅ Benefits : Lifetime Trading Fee Discount -50%
Exención de responsabilidad
La información y las publicaciones que ofrecemos, no implican ni constituyen un asesoramiento financiero, ni de inversión, trading o cualquier otro tipo de consejo o recomendación emitida o respaldada por TradingView. Puede obtener información adicional en las Condiciones de uso.