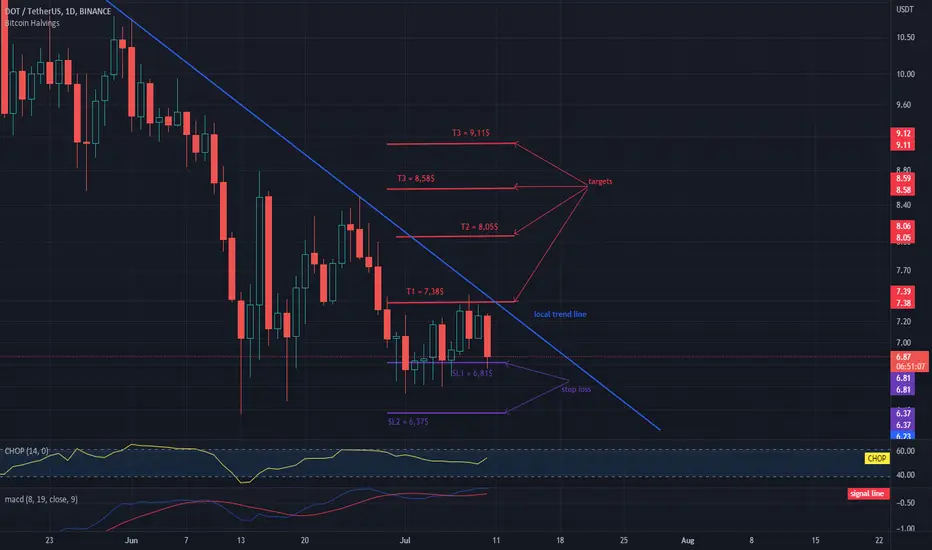
Hello everyone, let's take a look at the 1D DOT to USDT chart as you can see the price is moving below the local downtrend line.
Let's start by setting goals for the near future that we can consider:
T1 = $ 7.38
T2 = $ 8.05
T3 = $ 8.58
and
T3 = $ 9.11
Now let's move on to the stop loss in case of further market declines:
SL1 = $ 6.81
and
SL2 = $ 6.37
Looking at the CHOP indicator, we can see that in the 1D range we are gaining more and more energy, and the MACD indicator shows a local upward trend.
Exención de responsabilidad
La información y las publicaciones que ofrecemos, no implican ni constituyen un asesoramiento financiero, ni de inversión, trading o cualquier otro tipo de consejo o recomendación emitida o respaldada por TradingView. Puede obtener información adicional en las Condiciones de uso.