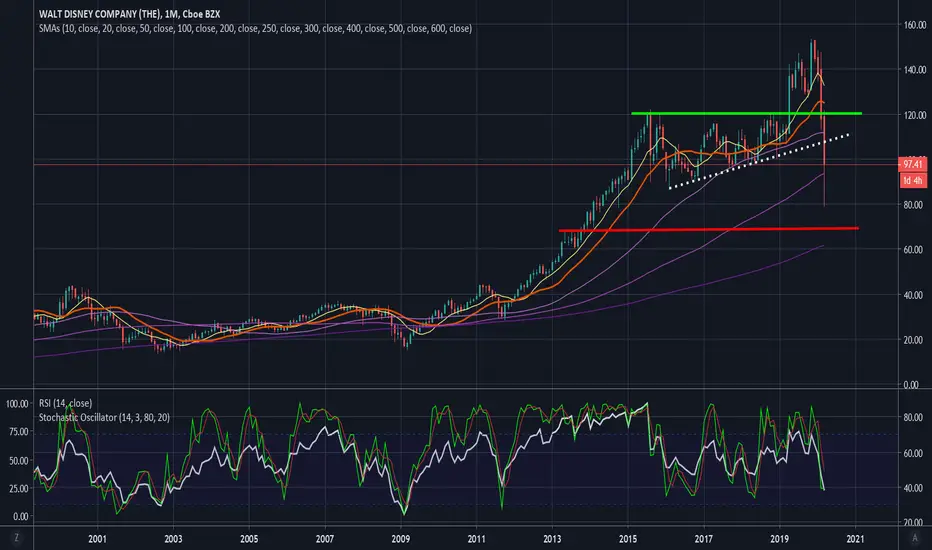
The white dotted line is from a previous chart. Stock may move up to that resistance line. It may also move up to 120 (green line) or down to 70 (red line). I am looking at daily RSI, along with other signals, to decide on puts or calls.
Operación activa
bought weekly 103 calls at 2.64. looking for 105 target and higherOperación cerrada manualmente
Out at 2.45. I see 30min resistance near 103, and RSI might stall around 60. daily RSI still below 50. stock may move up later but I lost confidence in trade after I took a better look at chart. IOperación activa
Opening puts. I suggest weekly 100 puts, or 4/17 95 strike.Exención de responsabilidad
La información y las publicaciones que ofrecemos, no implican ni constituyen un asesoramiento financiero, ni de inversión, trading o cualquier otro tipo de consejo o recomendación emitida o respaldada por TradingView. Puede obtener información adicional en las Condiciones de uso.
Exención de responsabilidad
La información y las publicaciones que ofrecemos, no implican ni constituyen un asesoramiento financiero, ni de inversión, trading o cualquier otro tipo de consejo o recomendación emitida o respaldada por TradingView. Puede obtener información adicional en las Condiciones de uso.