Maybe its is 'parabonoma'
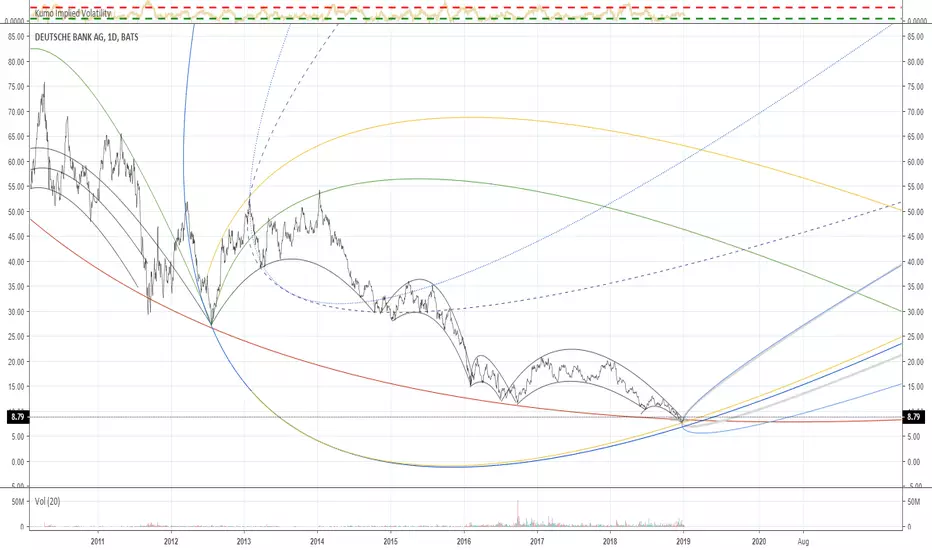
21 March 2012, to 24 July 2012
this maps to the present moment.
that is the corridor in Solid Blue/yellow dividing bilaterally the parabolas engendered by the break out of life. Will it survive. . . Cliff hanger
Is this phenomena, math? Weird chaos ripples?
21 March 2012, to 24 July 2012
this maps to the present moment.
that is the corridor in Solid Blue/yellow dividing bilaterally the parabolas engendered by the break out of life. Will it survive. . . Cliff hanger
Is this phenomena, math? Weird chaos ripples?
Nota
The curves are focused when the Blue and Yellow are focused. These are the same line. If They appear close, that is where in the pan the other parabolas are accurate.Nota
This chart, in review, is the prescient one./Publicaciones relacionadas
Exención de responsabilidad
La información y las publicaciones que ofrecemos, no implican ni constituyen un asesoramiento financiero, ni de inversión, trading o cualquier otro tipo de consejo o recomendación emitida o respaldada por TradingView. Puede obtener información adicional en las Condiciones de uso.
Publicaciones relacionadas
Exención de responsabilidad
La información y las publicaciones que ofrecemos, no implican ni constituyen un asesoramiento financiero, ni de inversión, trading o cualquier otro tipo de consejo o recomendación emitida o respaldada por TradingView. Puede obtener información adicional en las Condiciones de uso.