DAVE ( DAVE) — A Model CANSLIM Winner Showing Textbook Price & Volume Action
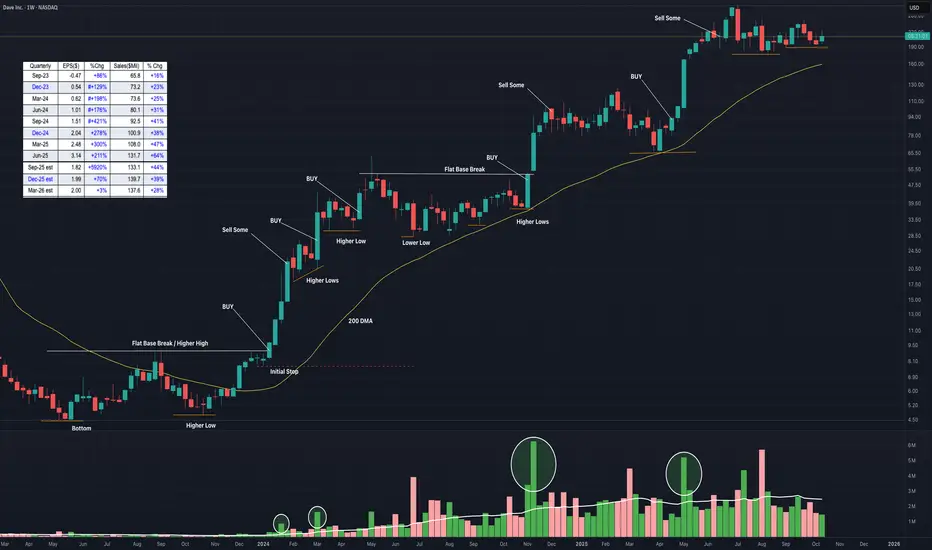
DAVE Inc. (DAVE) has delivered one of the most impressive runs in recent memory — rising over 6,000% from its May 2023 bottom to its July 2025 high.
This weekly chart captures the full CANSLIM progression:
-Flat-base breakout → higher highs → higher lows
-Explosive volume surges on each breakout
-Consolidations and 200-DMA support during corrections
-Textbook chart patterns (flat-base breakout, pennant, high-tight flag, etc.)
-Persistent institutional accumulation visible through volume rhythm
Each breakout aligned with rising earnings, strong sales growth, and expanding fund ownership — the hallmarks of a true market leader.
After a healthy consolidation, DAVE now trades constructively above its 200-day moving average. If the general market resumes its uptrend, this setup could mark the next leg higher in one of the strongest CANSLIM-style moves of this cycle.
DAVE Inc. (
This weekly chart captures the full CANSLIM progression:
-Flat-base breakout → higher highs → higher lows
-Explosive volume surges on each breakout
-Consolidations and 200-DMA support during corrections
-Textbook chart patterns (flat-base breakout, pennant, high-tight flag, etc.)
-Persistent institutional accumulation visible through volume rhythm
Each breakout aligned with rising earnings, strong sales growth, and expanding fund ownership — the hallmarks of a true market leader.
After a healthy consolidation, DAVE now trades constructively above its 200-day moving average. If the general market resumes its uptrend, this setup could mark the next leg higher in one of the strongest CANSLIM-style moves of this cycle.
Exención de responsabilidad
La información y las publicaciones no constituyen, ni deben considerarse como asesoramiento o recomendaciones financieras, de inversión, de trading o de otro tipo proporcionadas o respaldadas por TradingView. Más información en Condiciones de uso.
Exención de responsabilidad
La información y las publicaciones no constituyen, ni deben considerarse como asesoramiento o recomendaciones financieras, de inversión, de trading o de otro tipo proporcionadas o respaldadas por TradingView. Más información en Condiciones de uso.