CoreWeave  CRWV has risen more than 240% since its March initial public offering and some 300% since its April low -- including a roughly 13% leg up since just the stock's Sept. 26 session low. What does CRWV's fundamental and technical analysis say here?
Let's check things out:
CoreWeave's Fundamental Analysis
CRWV has been rising on multiple recent positive catalysts, with the latest one coming on Sept. 30.
Shares took off after Bloomberg News reported that morning that CRWV had signed a deal to supply social-media giant Meta Platforms META with up to $14.2 billion of AI-focused computing power.
CoreWeave, which later publicly confirmed the deal, will provide Meta with access to GB300 systems from Nvidia NVDA as part of the agreement.
The pact adds to CoreWeave's already-long list of elite clientele. Microsoft MSFT had been the firm's largest customer, while CoreWeave recently expanded an initial agreement with OpenAI into a contract worth an estimated $11.9 billion to $22.4 billion.
Interestingly, CoreWeave and OpenAI are both backed by Nvidia, while OpenAI is also backed by Microsoft.
For those not familiar with CoreWeave, it's a cloud/AI infrastructure-technology company.
The CoreWeave Cloud Platform combines software and cloud services to deliver increased efficiencies and automation that can better manage the complex infrastructures required to develop and run AI workloads.
The firm is involved with both large-language-model training and inference as well. That's crucial to the generative and agentic sides of artificial intelligence, which in my opinion is the future of how companies will eventually monetize AI (at least on the software side).
CoreWeave is a competitor to all of the major cloud-services providers. However, Oracle ORCL is emerging as the company's primary rival in providing elite-level, high-paying customers with GPU cloud solutions and high-performance computing.
CoreWeave's Technical Analysis
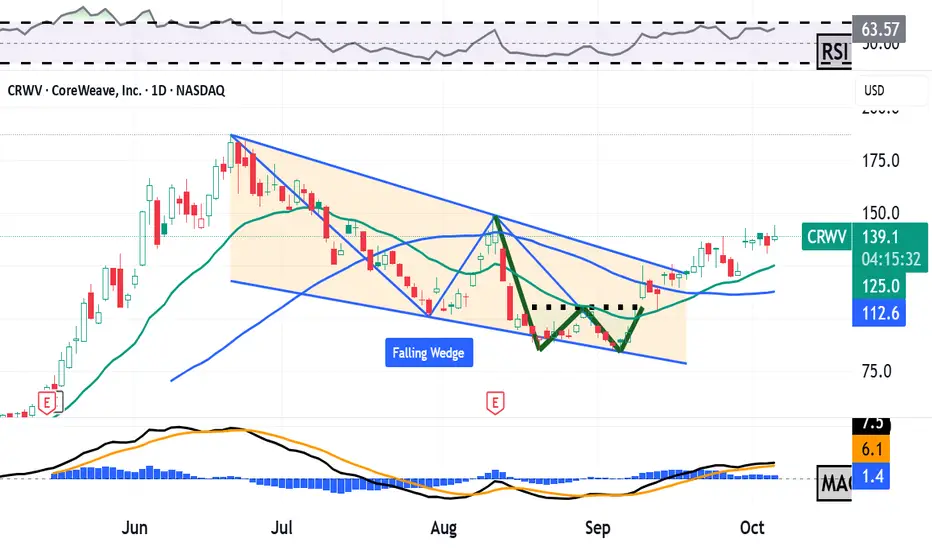
Here's CRWV's chart going back some five months and running through Wednesday afternoon:

There are multiple positive technical items visible on this chart.
First, I see a "falling-wedge" pattern of bullish reversal that ran from mid-June into mid-September, as marked with the red box above. I also see a double-bottom pattern of bullish reversal marked with a jagged green line.
These patterns both emerged just after CoreWeave sold off from its mid-June high of $187. The stock eventually bottomed out at $84.40 intraday on Sept. 5, but has rebounded some 60% since then.
That undoubtedly has many investors and traders asking themselves whether CRWV still has room to run.
Well, we see in the chart above that CoreWeave's 21-day Exponential Moving Average (or "EMA," marked with a green line above) recently crossed above the stock's 50-day Simple Moving Average (or "SMA," denoted with a blue line). This is known as a "swing trader's cross" or "mini-golden cross," which are considered bullish.
Meanwhile, CoreWeave took and held that 50-day SMA some two weeks ago. That probably encouraged some professional managers to increase long-side exposure.
The 50-day SMA line was also CoreWeave's pivot, and it stood at about $111 at the time vs. the stock's $134.79 close on Friday.
Also note that CoreWeave's Relative Strength Index (the gray line at the chart's top) is healthy, but looking nowhere close to technically overbought.
However, the stock's daily Moving Average Convergence Divergence indicator (or "MACD," marked with black and gold lines and blue bars at the chart's bottom), appears to be very bullishly postured.
Within the MACD, the 9-day EMA (the blue bars) has been above zero since early September.
Similarly, the 12-day EMA (the black line) has been above the 26-day EMA (the gold line) since early September, and both have been positive since mid-September. All of those things are typically bullish signals.
Reducing Net Basis
What if someone wants to get long on CoreWeave but is afraid that the horses might have already left the barn?
In this scenario, options traders often use a "buy-write" strategy (also known as a covered call) to lower their net basis on the stock.
This involves purchasing the underlying shares while also selling an equivalent amount of call options above the current stock price.
Here's an example that assumes CoreWeave will next report quarterly earnings in mid-November:
-- Purchase 100 shares of CRWV at or close to $135.75.
-- Sell (write) one Nov. 21 CRWV $160 call for about $10.30. This call will presumably expire after CoreWeave's next earnings release.
Net Basis: $125.45
Traders in this example have reduced their net basis by 7.6%, but also sold the right to someone else to purchase the shares at $160 up until the call's Nov. 21 expiration.
If the shares are called away, the trader's profit at expiration (assuming the covered call remains in place) would max out at 27.5%.
But if there's no exercise and the stock is at or below $160 at expiration, the trader would keep the entire $10.30 premium.
(Moomoo Technologies Inc. Markets Commentator Stephen "Sarge" Guilfoyle was short CRWV at the time of writing this column.)
This article discusses technical analysis, other approaches, including fundamental analysis, may offer very different views. The examples provided are for illustrative purposes only and are not intended to be reflective of the results you can expect to achieve. Specific security charts used are for illustrative purposes only and are not a recommendation, offer to sell, or a solicitation of an offer to buy any security. Past investment performance does not indicate or guarantee future success. Returns will vary, and all investments carry risks, including loss of principal. This content is also not a research report and is not intended to serve as the basis for any investment decision. The information contained in this article does not purport to be a complete description of the securities, markets, or developments referred to in this material. Moomoo and its affiliates make no representation or warranty as to the article's adequacy, completeness, accuracy or timeliness for any particular purpose of the above content. Furthermore, there is no guarantee that any statements, estimates, price targets, opinions or forecasts provided herein will prove to be correct.
Options trading is risky and not appropriate for everyone. Read the Options Disclosure Document (https://j.moomoo.com/017y9J) before trading. Options are complex and you may quickly lose the entire investment. Supporting docs for any claims will be furnished upon request.
Options trading subject to eligibility requirements. Strategies available will depend on options level approved.
Maximum potential loss and profit for options are calculated based on the single leg or an entire multi-leg trade remaining intact until expiration with no option contracts being exercised or assigned. These figures do not account for a portion of a multi-leg strategy being changed or removed or the trader assuming a short or long position in the underlying stock at or before expiration. Therefore, it is possible to lose more than the theoretical max loss of a strategy.
Moomoo is a financial information and trading app offered by Moomoo Technologies Inc. In the U.S., investment products and services on Moomoo are offered by Moomoo Financial Inc., Member FINRA/SIPC.
TradingView is an independent third party not affiliated with Moomoo Financial Inc., Moomoo Technologies Inc., or its affiliates. Moomoo Financial Inc. and its affiliates do not endorse, represent or warrant the completeness and accuracy of the data and information available on the TradingView platform and are not responsible for any services provided by the third-party platform.
Let's check things out:
CoreWeave's Fundamental Analysis
CRWV has been rising on multiple recent positive catalysts, with the latest one coming on Sept. 30.
Shares took off after Bloomberg News reported that morning that CRWV had signed a deal to supply social-media giant Meta Platforms
CoreWeave, which later publicly confirmed the deal, will provide Meta with access to GB300 systems from Nvidia
The pact adds to CoreWeave's already-long list of elite clientele. Microsoft
Interestingly, CoreWeave and OpenAI are both backed by Nvidia, while OpenAI is also backed by Microsoft.
For those not familiar with CoreWeave, it's a cloud/AI infrastructure-technology company.
The CoreWeave Cloud Platform combines software and cloud services to deliver increased efficiencies and automation that can better manage the complex infrastructures required to develop and run AI workloads.
The firm is involved with both large-language-model training and inference as well. That's crucial to the generative and agentic sides of artificial intelligence, which in my opinion is the future of how companies will eventually monetize AI (at least on the software side).
CoreWeave is a competitor to all of the major cloud-services providers. However, Oracle
CoreWeave's Technical Analysis
Here's CRWV's chart going back some five months and running through Wednesday afternoon:
There are multiple positive technical items visible on this chart.
First, I see a "falling-wedge" pattern of bullish reversal that ran from mid-June into mid-September, as marked with the red box above. I also see a double-bottom pattern of bullish reversal marked with a jagged green line.
These patterns both emerged just after CoreWeave sold off from its mid-June high of $187. The stock eventually bottomed out at $84.40 intraday on Sept. 5, but has rebounded some 60% since then.
That undoubtedly has many investors and traders asking themselves whether CRWV still has room to run.
Well, we see in the chart above that CoreWeave's 21-day Exponential Moving Average (or "EMA," marked with a green line above) recently crossed above the stock's 50-day Simple Moving Average (or "SMA," denoted with a blue line). This is known as a "swing trader's cross" or "mini-golden cross," which are considered bullish.
Meanwhile, CoreWeave took and held that 50-day SMA some two weeks ago. That probably encouraged some professional managers to increase long-side exposure.
The 50-day SMA line was also CoreWeave's pivot, and it stood at about $111 at the time vs. the stock's $134.79 close on Friday.
Also note that CoreWeave's Relative Strength Index (the gray line at the chart's top) is healthy, but looking nowhere close to technically overbought.
However, the stock's daily Moving Average Convergence Divergence indicator (or "MACD," marked with black and gold lines and blue bars at the chart's bottom), appears to be very bullishly postured.
Within the MACD, the 9-day EMA (the blue bars) has been above zero since early September.
Similarly, the 12-day EMA (the black line) has been above the 26-day EMA (the gold line) since early September, and both have been positive since mid-September. All of those things are typically bullish signals.
Reducing Net Basis
What if someone wants to get long on CoreWeave but is afraid that the horses might have already left the barn?
In this scenario, options traders often use a "buy-write" strategy (also known as a covered call) to lower their net basis on the stock.
This involves purchasing the underlying shares while also selling an equivalent amount of call options above the current stock price.
Here's an example that assumes CoreWeave will next report quarterly earnings in mid-November:
-- Purchase 100 shares of CRWV at or close to $135.75.
-- Sell (write) one Nov. 21 CRWV $160 call for about $10.30. This call will presumably expire after CoreWeave's next earnings release.
Net Basis: $125.45
Traders in this example have reduced their net basis by 7.6%, but also sold the right to someone else to purchase the shares at $160 up until the call's Nov. 21 expiration.
If the shares are called away, the trader's profit at expiration (assuming the covered call remains in place) would max out at 27.5%.
But if there's no exercise and the stock is at or below $160 at expiration, the trader would keep the entire $10.30 premium.
(Moomoo Technologies Inc. Markets Commentator Stephen "Sarge" Guilfoyle was short CRWV at the time of writing this column.)
This article discusses technical analysis, other approaches, including fundamental analysis, may offer very different views. The examples provided are for illustrative purposes only and are not intended to be reflective of the results you can expect to achieve. Specific security charts used are for illustrative purposes only and are not a recommendation, offer to sell, or a solicitation of an offer to buy any security. Past investment performance does not indicate or guarantee future success. Returns will vary, and all investments carry risks, including loss of principal. This content is also not a research report and is not intended to serve as the basis for any investment decision. The information contained in this article does not purport to be a complete description of the securities, markets, or developments referred to in this material. Moomoo and its affiliates make no representation or warranty as to the article's adequacy, completeness, accuracy or timeliness for any particular purpose of the above content. Furthermore, there is no guarantee that any statements, estimates, price targets, opinions or forecasts provided herein will prove to be correct.
Options trading is risky and not appropriate for everyone. Read the Options Disclosure Document (https://j.moomoo.com/017y9J) before trading. Options are complex and you may quickly lose the entire investment. Supporting docs for any claims will be furnished upon request.
Options trading subject to eligibility requirements. Strategies available will depend on options level approved.
Maximum potential loss and profit for options are calculated based on the single leg or an entire multi-leg trade remaining intact until expiration with no option contracts being exercised or assigned. These figures do not account for a portion of a multi-leg strategy being changed or removed or the trader assuming a short or long position in the underlying stock at or before expiration. Therefore, it is possible to lose more than the theoretical max loss of a strategy.
Moomoo is a financial information and trading app offered by Moomoo Technologies Inc. In the U.S., investment products and services on Moomoo are offered by Moomoo Financial Inc., Member FINRA/SIPC.
TradingView is an independent third party not affiliated with Moomoo Financial Inc., Moomoo Technologies Inc., or its affiliates. Moomoo Financial Inc. and its affiliates do not endorse, represent or warrant the completeness and accuracy of the data and information available on the TradingView platform and are not responsible for any services provided by the third-party platform.
Exención de responsabilidad
La información y las publicaciones no constituyen, ni deben considerarse como asesoramiento o recomendaciones financieras, de inversión, de trading o de otro tipo proporcionadas o respaldadas por TradingView. Más información en Condiciones de uso.
Exención de responsabilidad
La información y las publicaciones no constituyen, ni deben considerarse como asesoramiento o recomendaciones financieras, de inversión, de trading o de otro tipo proporcionadas o respaldadas por TradingView. Más información en Condiciones de uso.