Best Commodity layout
Crafting Your Optimal Commodity Technical Chart Layout in TradingView
The "best" commodity technical chart layout in TradingView is highly personalized, depending on your trading style, strategy, and the specific commodities you're analyzing. However, a well-structured layout should provide a clear, comprehensive view of price action and key technical indicators to aid in decision-making.
Here's a guide to creating an effective commodity technical chart layout in TradingView, incorporating common practices and versatile tools:
1. Choosing Your Main Chart Type:
Candlestick Charts: This is the most popular choice for most traders. Candlesticks provide detailed information about the open, high, low, and close (OHLC) prices for a specific period, making it easier to identify patterns and market sentiment.
Bar Charts: Similar to candlesticks, bar charts also display OHLC data but in a different visual format.
Line Charts: Useful for a quick overview of the overall trend, typically plotting the closing prices.
Heikin Ashi: These charts can help filter out market noise and make trends easier to identify by averaging price data.
Renko or Kagi Charts: These focus solely on price movement, ignoring time, and can be useful for identifying support and resistance levels.
Recommendation: Start with Candlestick charts for their detailed information. You can always switch to other types for different analytical perspectives.
2. Essential Technical Indicators for Commodities:
While the "best" set of indicators is subjective, here are some widely used and effective ones for commodity analysis in TradingView:
Moving Averages (MAs):
Types: Simple Moving Average (SMA) and Exponential Moving Average (EMA) are common. EMAs react faster to recent price changes.
Use: Identify trend direction, support/resistance levels, and potential crossover signals. Common periods include 20, 50, 100, and 200.
Layout: Add 2-3 MAs of different lengths directly onto your main price chart. For example, a 21-period EMA for short-term trends and a 50-period EMA for medium-term trends.
Volume Indicators:
Types: Volume (displays trading activity) and On-Balance Volume (OBV).
Use: Confirm the strength of price movements. A significant price move accompanied by high volume is generally considered more valid.
Layout: Typically displayed in a separate pane below the main price chart.
Oscillators (for identifying overbought/oversold conditions and momentum):
Relative Strength Index (RSI): Measures the speed and change of price movements. Values above 70 often indicate overbought conditions, while below 30 suggest oversold conditions. Standard period is 14.
Moving Average Convergence Divergence (MACD): Shows the relationship between two moving averages of an asset's price. It consists of the MACD line, signal line, and histogram.1 Used for trend identification and momentum.
1.
medium.com
medium.com
Stochastic Oscillator: Compares a particular closing price of an asset to a range of its prices over a certain period. Also used to identify overbought/oversold conditions.
Commodity Channel Index (CCI): Identifies cyclical trends and can signal overbought/oversold levels.
Layout: Oscillators are usually placed in separate panes below the main chart. You might choose 1 or 2 that best suit your strategy (e.g., RSI and MACD).
Volatility Indicators:
Bollinger Bands: Consist of a middle band (typically an SMA) and two outer bands representing standard deviations. They help identify volatility and potential price breakouts or mean reversion.
Keltner Channels: Similar to Bollinger Bands but use Average True Range (ATR) for the outer bands. Can be used for breakout and trend-following strategies.
Average True Range (ATR): Measures market volatility. Useful for setting stop-loss orders.
Layout: Bollinger Bands and Keltner Channels are overlaid on the main price chart. ATR is usually in a separate pane.
Trend-Following Indicators:
Ichimoku Cloud (Ichimoku Kinko Hyo): A comprehensive indicator that defines support/resistance, identifies trend direction, and provides trading signals. It includes several components like the Kumo (Cloud), Tenkan-sen, and Kijun-sen.
Donchian Channels: Plots the highest high and lowest low over a set period. Useful for identifying breakouts and trend direction.
Layout: Ichimoku Cloud and Donchian Channels are overlaid on the main price chart.
Recommendation for a Balanced Layout:
Main Chart: Candlesticks, 2-3 EMAs (e.g., 21, 50, 200), Bollinger Bands or Keltner Channels.
Pane 1 (below main): Volume.
Pane 2 (below main): RSI (14) or MACD.
Pane 3 (optional): CCI or ATR if your strategy heavily relies on them.
3. Drawing Tools:
Effective use of drawing tools is crucial for technical analysis:
Trendlines: Connect swing highs or lows to identify the direction and strength of trends.
Support and Resistance Levels: Horizontal lines drawn at key price levels where the price has historically struggled to break above (resistance) or fall below (support).
Fibonacci Retracement and Extension Levels: Help identify potential support/resistance levels and price targets based on Fibonacci ratios.
Channels: Parallel trendlines that can define a price range.
Chart Patterns: Use tools to identify patterns like head and shoulders, triangles, flags, and pennants.
Layout Tip: Keep your most frequently used drawing tools easily accessible in the TradingView drawing panel.
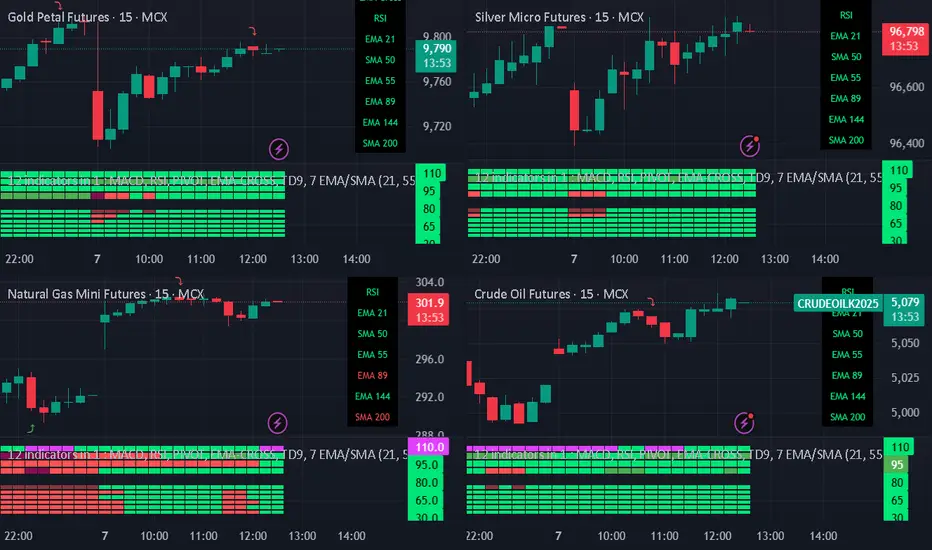
4. Multi-Timeframe Analysis & Multi-Chart Layouts:
Analyzing commodities across different timeframes can provide a broader market perspective. TradingView allows you to set up multi-chart layouts (the number of charts available depends on your subscription plan).
Common Setup:
Chart 1 (Long-Term): Weekly or Daily chart to identify the major trend.
Chart 2 (Medium-Term): 4-hour or Daily chart for more detailed trend analysis and identifying key levels.
Chart 3 (Short-Term): 1-hour or 15-minute chart for entry and exit signals.
Synchronization: TradingView allows you to synchronize symbols, crosshair, interval, and drawings across multiple charts in a layout, which can be very efficient.
5. Customization and Saving Your Layout:
Appearance: Customize chart colors (background, candles, grids), scales, and lines to your preference for better visual clarity and reduced eye strain. Access these via Chart Settings (the gear icon).
Saving Layouts: Once you have a setup you like, save it as a chart layout in TradingView. You can create multiple layouts for different commodities, strategies, or analytical purposes.
Indicator Templates: Save combinations of indicators as templates for quick application to new charts.
Tips for the "Best" Layout:
Keep it Clean: Avoid cluttering your chart with too many indicators. Focus on a few that you understand well and that complement your strategy.
Consistency: Use consistent settings for your indicators across different charts and timeframes.
Practice: The "best" layout is one that works for you. Experiment with different indicators and setups on a demo account or through backtesting to see what yields the best results for your trading style.
Stay Informed: Be aware that some commodities (e.g., agricultural products) can be influenced by seasonal patterns or specific reports (like USDA reports for crops, EIA for oil). While not a direct part of the "chart layout," integrating this knowledge with your technical analysis is crucial. TradingView has features to display key events like earnings reports or dividends, which can be relevant. Some community scripts on TradingView even offer overlays for planting and harvesting seasons for agricultural commodities.
By following these guidelines and experimenting to find what suits your individual needs, you can create a powerful and effective commodity technical chart layout in TradingView. Remember to regularly review and refine your layout as your trading strategies evolve.
Crafting Your Optimal Commodity Technical Chart Layout in TradingView
The "best" commodity technical chart layout in TradingView is highly personalized, depending on your trading style, strategy, and the specific commodities you're analyzing. However, a well-structured layout should provide a clear, comprehensive view of price action and key technical indicators to aid in decision-making.
Here's a guide to creating an effective commodity technical chart layout in TradingView, incorporating common practices and versatile tools:
1. Choosing Your Main Chart Type:
Candlestick Charts: This is the most popular choice for most traders. Candlesticks provide detailed information about the open, high, low, and close (OHLC) prices for a specific period, making it easier to identify patterns and market sentiment.
Bar Charts: Similar to candlesticks, bar charts also display OHLC data but in a different visual format.
Line Charts: Useful for a quick overview of the overall trend, typically plotting the closing prices.
Heikin Ashi: These charts can help filter out market noise and make trends easier to identify by averaging price data.
Renko or Kagi Charts: These focus solely on price movement, ignoring time, and can be useful for identifying support and resistance levels.
Recommendation: Start with Candlestick charts for their detailed information. You can always switch to other types for different analytical perspectives.
2. Essential Technical Indicators for Commodities:
While the "best" set of indicators is subjective, here are some widely used and effective ones for commodity analysis in TradingView:
Moving Averages (MAs):
Types: Simple Moving Average (SMA) and Exponential Moving Average (EMA) are common. EMAs react faster to recent price changes.
Use: Identify trend direction, support/resistance levels, and potential crossover signals. Common periods include 20, 50, 100, and 200.
Layout: Add 2-3 MAs of different lengths directly onto your main price chart. For example, a 21-period EMA for short-term trends and a 50-period EMA for medium-term trends.
Volume Indicators:
Types: Volume (displays trading activity) and On-Balance Volume (OBV).
Use: Confirm the strength of price movements. A significant price move accompanied by high volume is generally considered more valid.
Layout: Typically displayed in a separate pane below the main price chart.
Oscillators (for identifying overbought/oversold conditions and momentum):
Relative Strength Index (RSI): Measures the speed and change of price movements. Values above 70 often indicate overbought conditions, while below 30 suggest oversold conditions. Standard period is 14.
Moving Average Convergence Divergence (MACD): Shows the relationship between two moving averages of an asset's price. It consists of the MACD line, signal line, and histogram.1 Used for trend identification and momentum.
1.
medium.com
medium.com
Stochastic Oscillator: Compares a particular closing price of an asset to a range of its prices over a certain period. Also used to identify overbought/oversold conditions.
Commodity Channel Index (CCI): Identifies cyclical trends and can signal overbought/oversold levels.
Layout: Oscillators are usually placed in separate panes below the main chart. You might choose 1 or 2 that best suit your strategy (e.g., RSI and MACD).
Volatility Indicators:
Bollinger Bands: Consist of a middle band (typically an SMA) and two outer bands representing standard deviations. They help identify volatility and potential price breakouts or mean reversion.
Keltner Channels: Similar to Bollinger Bands but use Average True Range (ATR) for the outer bands. Can be used for breakout and trend-following strategies.
Average True Range (ATR): Measures market volatility. Useful for setting stop-loss orders.
Layout: Bollinger Bands and Keltner Channels are overlaid on the main price chart. ATR is usually in a separate pane.
Trend-Following Indicators:
Ichimoku Cloud (Ichimoku Kinko Hyo): A comprehensive indicator that defines support/resistance, identifies trend direction, and provides trading signals. It includes several components like the Kumo (Cloud), Tenkan-sen, and Kijun-sen.
Donchian Channels: Plots the highest high and lowest low over a set period. Useful for identifying breakouts and trend direction.
Layout: Ichimoku Cloud and Donchian Channels are overlaid on the main price chart.
Recommendation for a Balanced Layout:
Main Chart: Candlesticks, 2-3 EMAs (e.g., 21, 50, 200), Bollinger Bands or Keltner Channels.
Pane 1 (below main): Volume.
Pane 2 (below main): RSI (14) or MACD.
Pane 3 (optional): CCI or ATR if your strategy heavily relies on them.
3. Drawing Tools:
Effective use of drawing tools is crucial for technical analysis:
Trendlines: Connect swing highs or lows to identify the direction and strength of trends.
Support and Resistance Levels: Horizontal lines drawn at key price levels where the price has historically struggled to break above (resistance) or fall below (support).
Fibonacci Retracement and Extension Levels: Help identify potential support/resistance levels and price targets based on Fibonacci ratios.
Channels: Parallel trendlines that can define a price range.
Chart Patterns: Use tools to identify patterns like head and shoulders, triangles, flags, and pennants.
Layout Tip: Keep your most frequently used drawing tools easily accessible in the TradingView drawing panel.
4. Multi-Timeframe Analysis & Multi-Chart Layouts:
Analyzing commodities across different timeframes can provide a broader market perspective. TradingView allows you to set up multi-chart layouts (the number of charts available depends on your subscription plan).
Common Setup:
Chart 1 (Long-Term): Weekly or Daily chart to identify the major trend.
Chart 2 (Medium-Term): 4-hour or Daily chart for more detailed trend analysis and identifying key levels.
Chart 3 (Short-Term): 1-hour or 15-minute chart for entry and exit signals.
Synchronization: TradingView allows you to synchronize symbols, crosshair, interval, and drawings across multiple charts in a layout, which can be very efficient.
5. Customization and Saving Your Layout:
Appearance: Customize chart colors (background, candles, grids), scales, and lines to your preference for better visual clarity and reduced eye strain. Access these via Chart Settings (the gear icon).
Saving Layouts: Once you have a setup you like, save it as a chart layout in TradingView. You can create multiple layouts for different commodities, strategies, or analytical purposes.
Indicator Templates: Save combinations of indicators as templates for quick application to new charts.
Tips for the "Best" Layout:
Keep it Clean: Avoid cluttering your chart with too many indicators. Focus on a few that you understand well and that complement your strategy.
Consistency: Use consistent settings for your indicators across different charts and timeframes.
Practice: The "best" layout is one that works for you. Experiment with different indicators and setups on a demo account or through backtesting to see what yields the best results for your trading style.
Stay Informed: Be aware that some commodities (e.g., agricultural products) can be influenced by seasonal patterns or specific reports (like USDA reports for crops, EIA for oil). While not a direct part of the "chart layout," integrating this knowledge with your technical analysis is crucial. TradingView has features to display key events like earnings reports or dividends, which can be relevant. Some community scripts on TradingView even offer overlays for planting and harvesting seasons for agricultural commodities.
By following these guidelines and experimenting to find what suits your individual needs, you can create a powerful and effective commodity technical chart layout in TradingView. Remember to regularly review and refine your layout as your trading strategies evolve.
Exención de responsabilidad
La información y las publicaciones no pretenden ser, ni constituyen, asesoramiento o recomendaciones financieras, de inversión, de trading o de otro tipo proporcionadas o respaldadas por TradingView. Más información en Condiciones de uso.
Exención de responsabilidad
La información y las publicaciones no pretenden ser, ni constituyen, asesoramiento o recomendaciones financieras, de inversión, de trading o de otro tipo proporcionadas o respaldadas por TradingView. Más información en Condiciones de uso.