CESC Daily Timeframe Analysis
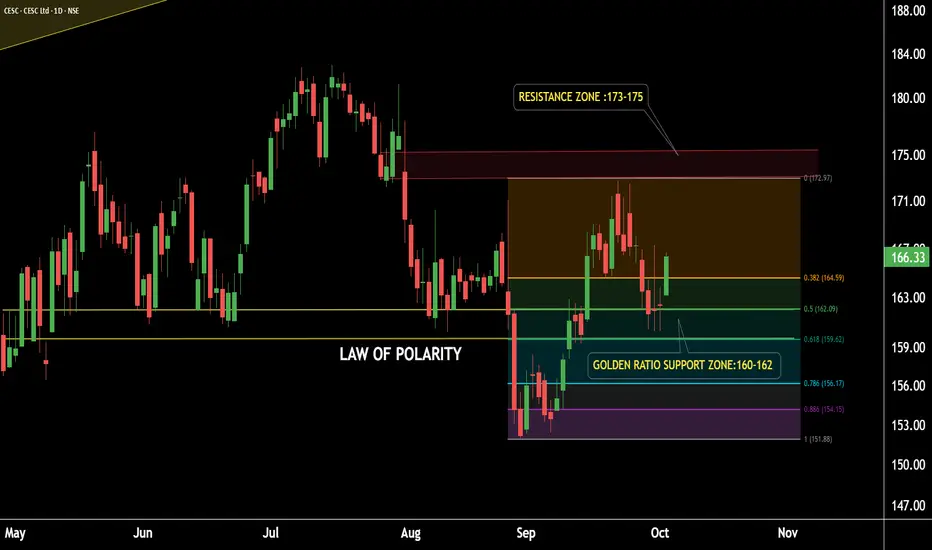
CESC is sustaining above its Law of Polarity (LOP) after a breakout.
The stock has successfully retested the LOP and is showing strength.
This level also aligns with the Golden Ratio Zone of Fibonacci Retracement, representing a strong support zone around 159–162.
Potential Upside Target: 172–175.
If the support zone sustains, we may see higher prices in CESC.
Thank you!
@RahulSaraoge
Connect us at t.me/stridesadvisory
Connect us at t.me/stridesadvisory
Exención de responsabilidad
La información y las publicaciones que ofrecemos, no implican ni constituyen un asesoramiento financiero, ni de inversión, trading o cualquier otro tipo de consejo o recomendación emitida o respaldada por TradingView. Puede obtener información adicional en las Condiciones de uso.