Hallo traders,
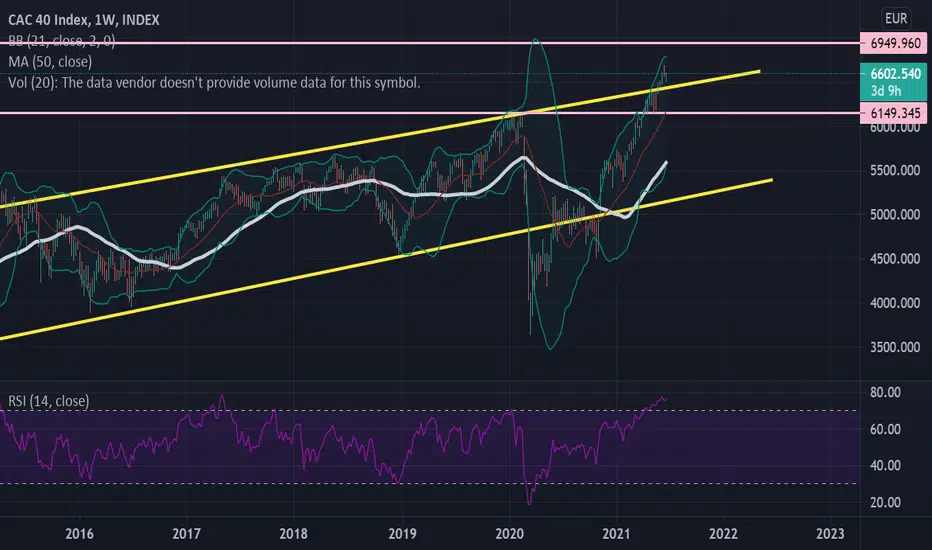
This weekly chart shows CAC40 in move.
Seems the index broke above the resistance line, the RSI is little over-bought, but i can't see any sign of weakness.
I'm looking for shorting opportunity here.
Your comments are very welcome.
Samy
This weekly chart shows CAC40 in move.
Seems the index broke above the resistance line, the RSI is little over-bought, but i can't see any sign of weakness.
I'm looking for shorting opportunity here.
Your comments are very welcome.
Samy
Exención de responsabilidad
La información y las publicaciones que ofrecemos, no implican ni constituyen un asesoramiento financiero, ni de inversión, trading o cualquier otro tipo de consejo o recomendación emitida o respaldada por TradingView. Puede obtener información adicional en las Condiciones de uso.