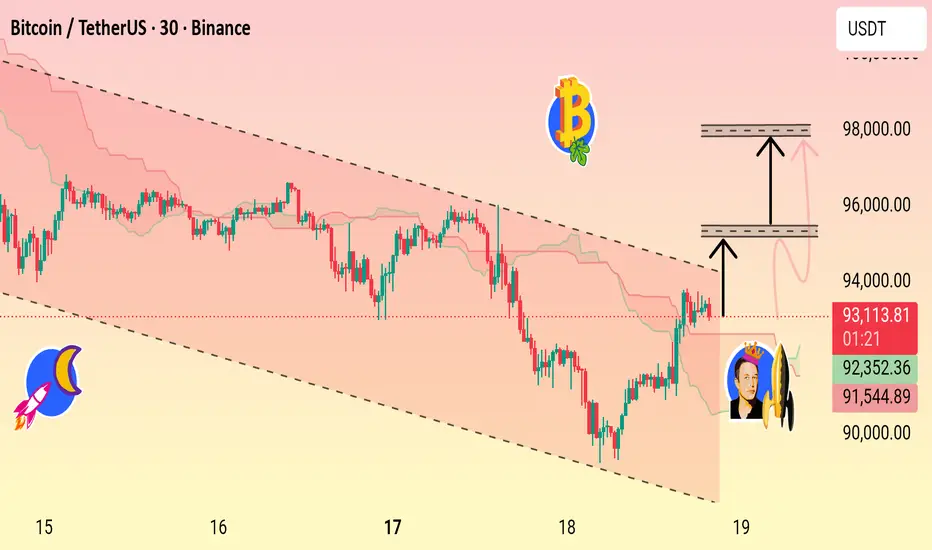
This chart shows BTC/USDT on the 30-minute timeframe as price pushes against the upper boundary of a multi-day descending channel. After a strong rebound from the lower trendline, Bitcoin is attempting to break out of the channel and move toward the highlighted resistance zones.
Key levels marked:
$95,000 — first major resistance / breakout confirmation
$97,500 — projected upside target if momentum continues
The chart includes visual annotations suggesting a potential bullish continuation if price closes above resistance. Indicators such as the Ichimoku cloud provide additional context for trend strength.
1. Descending Channel Structure
The price has been moving inside a downward-sloping channel for several days (15–19 Nov).
Upper trendline: consistently acting as resistance.
Lower trendline: providing support with clean rebounds.
Price recently touched the lower boundary and is now climbing back toward the top of the channel.
---
2. Breakout Attempt
As of the right side of the chart:
BTC has pierced or is testing the upper channel boundary, showing the first sign of bullish pressure.
The candles near the breakout attempt show stronger upward momentum compared to the previous consolidation.
This is visually represented by the upward arrows and the user-drawn breakout path.
---
3. Ichimoku Cloud Context
The Ichimoku cloud appears:
Mostly thin and red earlier, signaling prior weakness.
Near the breakout zone, the price is moving above or challenging the cloud, which usually indicates a shift toward short-term bullish sentiment.
---
4. Marked Levels
Two key horizontal zones are highlighted:
▫️95,000 USDT
This is the first resistance and likely the breakout confirmation level.
A clean close above this zone would suggest the channel breakout is real, not a fakeout.
Operación activa
Join free telegram channel
t.me/+UlkzSENzAv4wOTc0
Daily 3-5 signals
Xauusd Gold updates
Free signal telegram channel
t.me/+pA0kQEvdgQ9hMWM0
t.me/+UlkzSENzAv4wOTc0
Daily 3-5 signals
Xauusd Gold updates
Free signal telegram channel
t.me/+pA0kQEvdgQ9hMWM0
Publicaciones relacionadas
Exención de responsabilidad
La información y las publicaciones no pretenden ser, ni constituyen, asesoramiento o recomendaciones financieras, de inversión, de trading o de otro tipo proporcionadas o respaldadas por TradingView. Más información en Condiciones de uso.