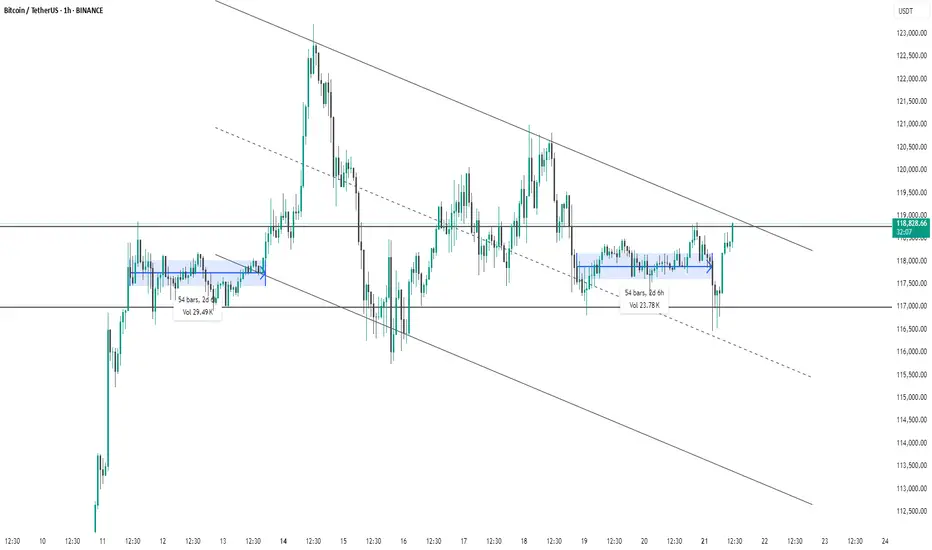
This 1-hour chart of Bitcoin/USDT (Binance) shows a descending channel pattern with clearly defined upper and lower trendlines. Price has recently broken out of a consolidation zone (highlighted in blue) and is now testing the upper boundary of the descending channel near $119,000. The breakout from the recent range (lasting 54 bars / 2d 6h with 23.78K volume) suggests bullish momentum. However, for confirmation of trend reversal, a strong breakout above the channel is needed. Until then, the broader downtrend structure remains intact.
thanking you
thanking you
Publicaciones relacionadas
Exención de responsabilidad
La información y las publicaciones que ofrecemos, no implican ni constituyen un asesoramiento financiero, ni de inversión, trading o cualquier otro tipo de consejo o recomendación emitida o respaldada por TradingView. Puede obtener información adicional en las Condiciones de uso.