1️⃣ BTC

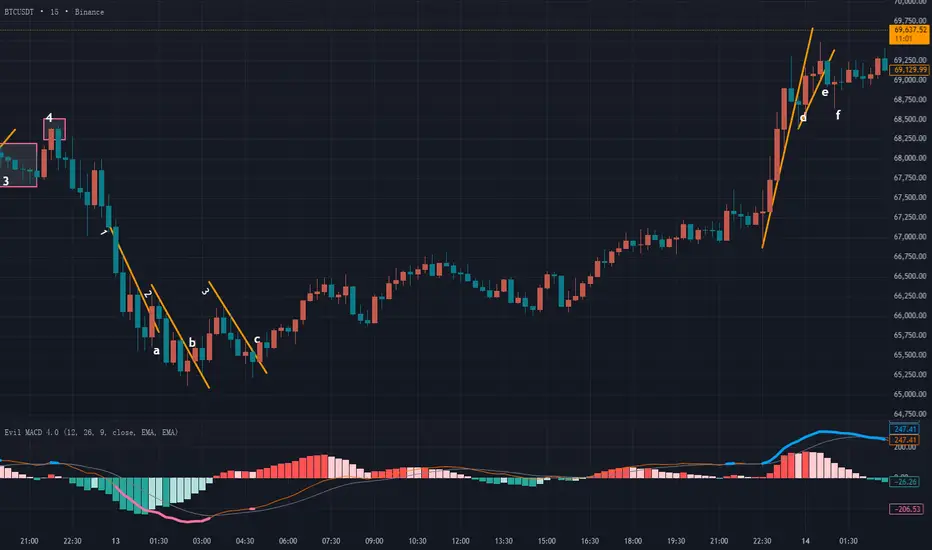
The session started with a clean and smooth downtrend, although the internal structure was slightly complex. Let’s break it down step by step.
First, we can draw Trendline 1. However, this trendline had not been validated by the market. Before point a, price never truly respected or tested the line — there was visible space between candles and the trendline.
Price broke above it at point a. The candle was mostly body with small wicks, technically meeting the basic breakout condition. However, the quality was mediocre:
The trendline was unverified.
The breakout was only marginal.
Price barely separated from the line.
Aggressive traders might consider this a reversal. Conservative traders would wait.
After the failure at a, Trendline 2 formed. This one had proper market validation. Therefore, its structural quality was higher.
At point b, price broke above Trendline 2. Although there was an upper wick, it was slightly smaller than the body. The breakout quality was acceptable and risk manageable. A structural reversal could be considered here.
Later, after a short rally and pullback, Trendline 3 formed — again validated by the market.
At point c, we saw a full-bodied bullish candle with no wick, clearly separating from the trendline. Compared to a and b, point c showed the strongest bullish momentum.
Let’s compare the three breakout points objectively:
a – Unvalidated trendline, 70% body, marginal breakout
b – Validated trendline, 60% body, marginal breakout
c – Validated trendline, 100% body, clear breakout
The difference becomes obvious.
Many traders do not perform this type of comparative analysis. Entry decisions are often emotional. But the market is objective. Our opinions are subjective.
When we compare structural elements using measurable conditions, we remove emotion from decision-making.
2️⃣ ETH

ETH displayed highly similar behavior to BTC — something that happens frequently.
After a smooth decline, a bottom warning appeared. Trendline 1 was formed and broken at point a.
However, candle a was a doji — no real body. A doji represents strong conflict between buyers and sellers.
Candle b had around a 50% body ratio — not strong enough to confirm reversal. This remained a battlefield zone.
Trendline 2 then formed. At c, price broke above it, but the body was even smaller than before. Momentum remained weak.
At d, another small doji confirmed continued indecision.
Only at e did we see a 70–80% full-bodied bullish candle, clearly breaking away from the consolidation zone.
That was the true structural reversal point.
Objective comparison:
a – Validated trendline, 0% body, marginal breakout
b – Validated trendline, 50% body, marginal breakout
c – Validated trendline, 30% body, marginal breakout
d – Validated trendline, 5% body, marginal breakout
e – Validated trendline, 70% body, clear breakout
All conditions above are observable and objective.
After point e, the pullback (area f) showed progressively smaller bearish candles — a sign of weakening selling pressure.
This aligns with concepts from the Wyckoff methodology, where diminishing momentum reflects exhaustion.
3️⃣ Gold

Today’s gold market was a classic example of:
“Movement without opportunity.”
After a large bottom warning, Trendline 1 formed and broke at a.
However:
The trendline was not validated.
The prior move was extremely volatile.
The breakout occurred after abnormal expansion.
These are high-risk conditions.
Trendline 2 formed and broke at b, but again, the candle was a doji. Subsequent candles remained small-bodied. No clear dominance.
Finally, Trendline 3 formed. Notice the sudden long lower wick before it — similar to the earlier volatility spike. The breakout itself came with exaggerated bearish expansion.
When volatility expands suddenly, structure quality deteriorates.
Best decision: stay out.
Summary
Our opinions are subjective.
The market is objective.
Trendline validation is objective.
Body ratio is measurable.
Breakout distance is observable.
When decisions are based on objective structure, emotion exits naturally.
Trading is not prediction.
Trading is selection.
There are opportunities and traps every day.
Capital is like ammunition.
If we fire at every signal, we waste bullets.
A disciplined trader behaves like a sniper:
Most of the time waiting.
Rarely pulling the trigger.
Only acting when structure quality is high.
When you apply this filtering logic, trading becomes quieter — and clearer.
The session started with a clean and smooth downtrend, although the internal structure was slightly complex. Let’s break it down step by step.
First, we can draw Trendline 1. However, this trendline had not been validated by the market. Before point a, price never truly respected or tested the line — there was visible space between candles and the trendline.
Price broke above it at point a. The candle was mostly body with small wicks, technically meeting the basic breakout condition. However, the quality was mediocre:
The trendline was unverified.
The breakout was only marginal.
Price barely separated from the line.
Aggressive traders might consider this a reversal. Conservative traders would wait.
After the failure at a, Trendline 2 formed. This one had proper market validation. Therefore, its structural quality was higher.
At point b, price broke above Trendline 2. Although there was an upper wick, it was slightly smaller than the body. The breakout quality was acceptable and risk manageable. A structural reversal could be considered here.
Later, after a short rally and pullback, Trendline 3 formed — again validated by the market.
At point c, we saw a full-bodied bullish candle with no wick, clearly separating from the trendline. Compared to a and b, point c showed the strongest bullish momentum.
Let’s compare the three breakout points objectively:
a – Unvalidated trendline, 70% body, marginal breakout
b – Validated trendline, 60% body, marginal breakout
c – Validated trendline, 100% body, clear breakout
The difference becomes obvious.
Many traders do not perform this type of comparative analysis. Entry decisions are often emotional. But the market is objective. Our opinions are subjective.
When we compare structural elements using measurable conditions, we remove emotion from decision-making.
2️⃣ ETH
ETH displayed highly similar behavior to BTC — something that happens frequently.
After a smooth decline, a bottom warning appeared. Trendline 1 was formed and broken at point a.
However, candle a was a doji — no real body. A doji represents strong conflict between buyers and sellers.
Candle b had around a 50% body ratio — not strong enough to confirm reversal. This remained a battlefield zone.
Trendline 2 then formed. At c, price broke above it, but the body was even smaller than before. Momentum remained weak.
At d, another small doji confirmed continued indecision.
Only at e did we see a 70–80% full-bodied bullish candle, clearly breaking away from the consolidation zone.
That was the true structural reversal point.
Objective comparison:
a – Validated trendline, 0% body, marginal breakout
b – Validated trendline, 50% body, marginal breakout
c – Validated trendline, 30% body, marginal breakout
d – Validated trendline, 5% body, marginal breakout
e – Validated trendline, 70% body, clear breakout
All conditions above are observable and objective.
After point e, the pullback (area f) showed progressively smaller bearish candles — a sign of weakening selling pressure.
This aligns with concepts from the Wyckoff methodology, where diminishing momentum reflects exhaustion.
3️⃣ Gold
Today’s gold market was a classic example of:
“Movement without opportunity.”
After a large bottom warning, Trendline 1 formed and broke at a.
However:
The trendline was not validated.
The prior move was extremely volatile.
The breakout occurred after abnormal expansion.
These are high-risk conditions.
Trendline 2 formed and broke at b, but again, the candle was a doji. Subsequent candles remained small-bodied. No clear dominance.
Finally, Trendline 3 formed. Notice the sudden long lower wick before it — similar to the earlier volatility spike. The breakout itself came with exaggerated bearish expansion.
When volatility expands suddenly, structure quality deteriorates.
Best decision: stay out.
Summary
Our opinions are subjective.
The market is objective.
Trendline validation is objective.
Body ratio is measurable.
Breakout distance is observable.
When decisions are based on objective structure, emotion exits naturally.
Trading is not prediction.
Trading is selection.
There are opportunities and traps every day.
Capital is like ammunition.
If we fire at every signal, we waste bullets.
A disciplined trader behaves like a sniper:
Most of the time waiting.
Rarely pulling the trigger.
Only acting when structure quality is high.
When you apply this filtering logic, trading becomes quieter — and clearer.
Discord:discord.com/users/1044898599974223902
Contact author to access Invite-Only script
公众号:介喜Jessie
以上渠道可联系作者开通指标
Contact author to access Invite-Only script
公众号:介喜Jessie
以上渠道可联系作者开通指标
Exención de responsabilidad
La información y las publicaciones no constituyen, ni deben considerarse como asesoramiento o recomendaciones financieras, de inversión, de trading o de otro tipo proporcionadas o respaldadas por TradingView. Más información en Condiciones de uso.