Hi traders,
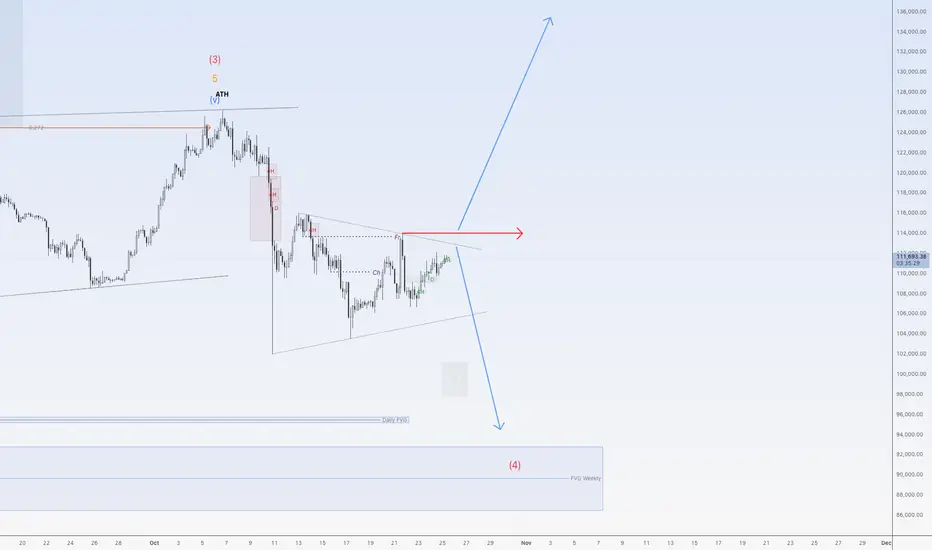
Last week Bitcoin made correction up (bearish), went down and made another correction up.
It looks like it is forming a (bullish or bearish) Triangle.
So now we could see more downside to the lower Weekly FVG.
If price breaks the red arrow, the Triangle (bearish) is invalid and we could see price go up again for the next impulse wave.
Let's see what the market does and react.
Trade idea: Wait for a correction up on a smaller timeframe to trade shorts.
This shared post is only my point of view on what could be the next move in this pair based on my technical analysis.
But I react and trade on what I see in the chart, not what I've predicted or expect.
Don't be emotional, just trade your plan!
Eduwave
Nota
Bitcoin closed above the red arrow, so now we could see more upside again.Nota
The big wick down to 102,5K on the chart above is not as big on the chart of other exchanges which makes the first downmove not three waves but five. So the first downmove is impulsive (Wave 1 or A) which makes the correction up Wave 2 or B (close above red arrow is invalid) and we could see anothher move down for wave 3 or C.🆓 Check my IG for free education
💯 More (free) products: eduwavetrading.gumroad
📈 I don't need your money. But if u want (financial) freedom and learn to analyze like this, join my VIP Discord: eduwavetrading.gumroad.com/l/vipdiscord
💯 More (free) products: eduwavetrading.gumroad
📈 I don't need your money. But if u want (financial) freedom and learn to analyze like this, join my VIP Discord: eduwavetrading.gumroad.com/l/vipdiscord
Exención de responsabilidad
La información y las publicaciones que ofrecemos, no implican ni constituyen un asesoramiento financiero, ni de inversión, trading o cualquier otro tipo de consejo o recomendación emitida o respaldada por TradingView. Puede obtener información adicional en las Condiciones de uso.
🆓 Check my IG for free education
💯 More (free) products: eduwavetrading.gumroad
📈 I don't need your money. But if u want (financial) freedom and learn to analyze like this, join my VIP Discord: eduwavetrading.gumroad.com/l/vipdiscord
💯 More (free) products: eduwavetrading.gumroad
📈 I don't need your money. But if u want (financial) freedom and learn to analyze like this, join my VIP Discord: eduwavetrading.gumroad.com/l/vipdiscord
Exención de responsabilidad
La información y las publicaciones que ofrecemos, no implican ni constituyen un asesoramiento financiero, ni de inversión, trading o cualquier otro tipo de consejo o recomendación emitida o respaldada por TradingView. Puede obtener información adicional en las Condiciones de uso.