BTCusdt — Descending Triangle. Preparing for a BTC Breakdown?
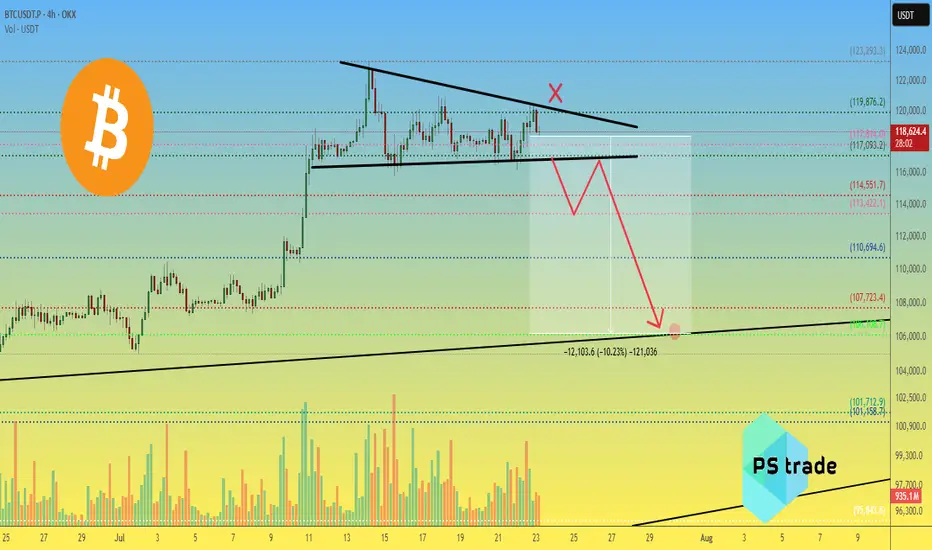
Price is being compressed under a descending trendline, and volume is steadily declining — a typical signal of an upcoming strong move.
📉 Downside target: $106,100 – $101,700
🔺 Invalidation: breakout above $119,876
📊 Key levels:
Resistance: $117000 / $113,500
Support: $110,694 / $107,723 / $106,108 / $101,712
⚠️ Pay attention — breakout is likely soon.
_____________________
Did you like our analysis? Leave a comment, like, and follow to get more
🎁 -20% for ALL trading fees at #OKX 👇
okx.com/join/20PSTRADE
🔥 V-I-P 👉 t.me/P_S_trade_menue_bot
🔵 Telegram 👉 t.me/pstrade_eng
🤖 Trading Bot 👉 copytrading.space/en/
📞 t.me/P_S_trades 📝
okx.com/join/20PSTRADE
🔥 V-I-P 👉 t.me/P_S_trade_menue_bot
🔵 Telegram 👉 t.me/pstrade_eng
🤖 Trading Bot 👉 copytrading.space/en/
📞 t.me/P_S_trades 📝
Publicaciones relacionadas
Exención de responsabilidad
The information and publications are not meant to be, and do not constitute, financial, investment, trading, or other types of advice or recommendations supplied or endorsed by TradingView. Read more in the Terms of Use.