GARTLEY PATTERN coming to and and.
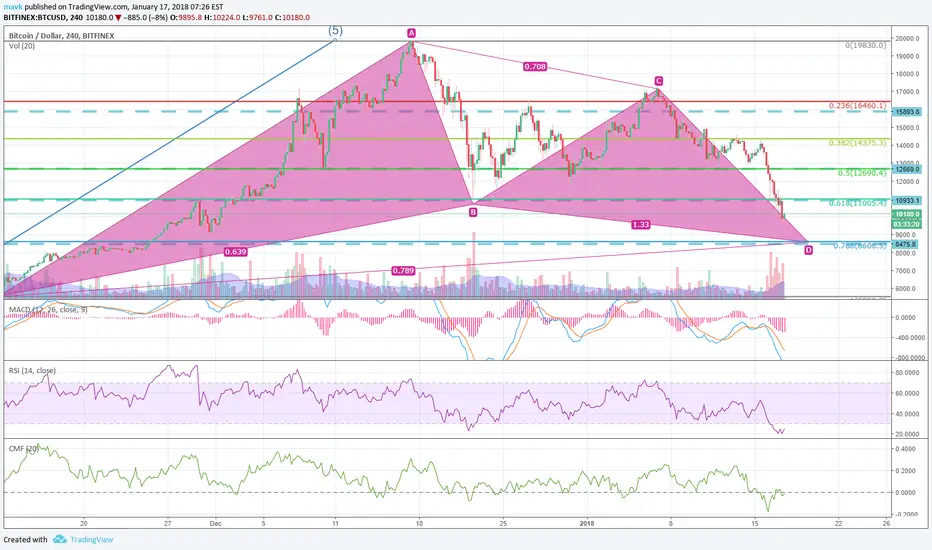
This here is a almost perfect example of Gartley's pattern, numbers which are specified for this pattern are almost 100% correct here!
Buy between 8600-11000..
Ps. RSI is extremely oversold on this 4h chart.
This here is a almost perfect example of Gartley's pattern, numbers which are specified for this pattern are almost 100% correct here!
Buy between 8600-11000..
Ps. RSI is extremely oversold on this 4h chart.
Nota
MACD and RSI started showing divergence on 1hour candlesticks. Good sign as we are getting closer to the bottom support 8600. Dip is going to be over soon.Nota
Quasimodo showing in 15min candles. Possible long entry!Exención de responsabilidad
La información y las publicaciones que ofrecemos, no implican ni constituyen un asesoramiento financiero, ni de inversión, trading o cualquier otro tipo de consejo o recomendación emitida o respaldada por TradingView. Puede obtener información adicional en las Condiciones de uso.
Exención de responsabilidad
La información y las publicaciones que ofrecemos, no implican ni constituyen un asesoramiento financiero, ni de inversión, trading o cualquier otro tipo de consejo o recomendación emitida o respaldada por TradingView. Puede obtener información adicional en las Condiciones de uso.