Bullish Catalyst Technical Signals: Breakout Validity & Momentum Accumulation
1.Key Resistance Converted to Support, Bullish Structure Confirmed
The price has stabilized above the critical 200-hour SMA level at $88,000, which has now switched from a resistance barrier to the primary support level. Together with the recent consolidation low of $87,700, it forms a dual support zone.
The daily MACD has formed a golden cross after volume contraction, with the red bars starting to expand. Combined with the gradual accumulation of momentum on the 4-hour timeframe, the rebound structure is further reinforced. Historical data shows that after breaking through the 200-hour SMA and holding steady for 24 hours, the probability of short-term upward continuation exceeds 70%.
2. Oversold Recovery Resonates with Support Levels
The daily RSI has rebounded from the oversold zone to the 38-40 range, moving out of the weak price territory. The valid support from the lower Bollinger Band has fueled the rebound; currently, the price is trading between the middle and lower bands of the Bollinger Bands, creating strong demand to move back toward the middle band.
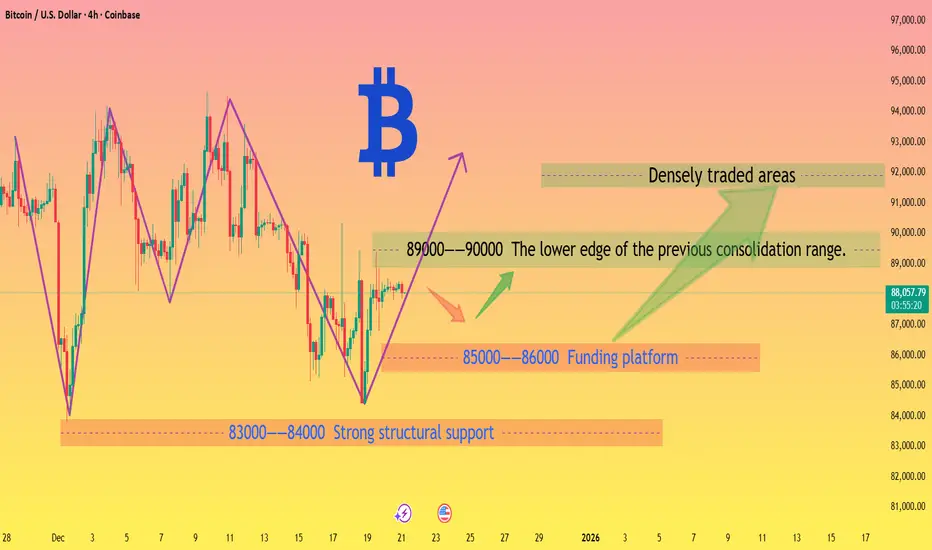
The $85,000-$86,000 range is a proven strong support level that has stood multiple tests. Coupled with robust on-chain capital absorption, it forms a bottom safety cushion, significantly reducing the risk of a sharp decline.
3. Chip Structure Provides a Support Foundation
Although high-level chips have shown signs of loosening, there have been multiple instances of capital bargain-hunting around the $85,000 level, forming a periodic concentrated chip zone that underpins the rebound. The long and short liquidations over the past 24 hours have been relatively balanced; sufficient capital game amid bull-bear divergence is conducive to the clarification of the subsequent trend.
Bitcoin trading strategy
buy:87000-88000
tp:89000-90000-92000
1.Key Resistance Converted to Support, Bullish Structure Confirmed
The price has stabilized above the critical 200-hour SMA level at $88,000, which has now switched from a resistance barrier to the primary support level. Together with the recent consolidation low of $87,700, it forms a dual support zone.
The daily MACD has formed a golden cross after volume contraction, with the red bars starting to expand. Combined with the gradual accumulation of momentum on the 4-hour timeframe, the rebound structure is further reinforced. Historical data shows that after breaking through the 200-hour SMA and holding steady for 24 hours, the probability of short-term upward continuation exceeds 70%.
2. Oversold Recovery Resonates with Support Levels
The daily RSI has rebounded from the oversold zone to the 38-40 range, moving out of the weak price territory. The valid support from the lower Bollinger Band has fueled the rebound; currently, the price is trading between the middle and lower bands of the Bollinger Bands, creating strong demand to move back toward the middle band.
The $85,000-$86,000 range is a proven strong support level that has stood multiple tests. Coupled with robust on-chain capital absorption, it forms a bottom safety cushion, significantly reducing the risk of a sharp decline.
3. Chip Structure Provides a Support Foundation
Although high-level chips have shown signs of loosening, there have been multiple instances of capital bargain-hunting around the $85,000 level, forming a periodic concentrated chip zone that underpins the rebound. The long and short liquidations over the past 24 hours have been relatively balanced; sufficient capital game amid bull-bear divergence is conducive to the clarification of the subsequent trend.
Bitcoin trading strategy
buy:87000-88000
tp:89000-90000-92000
Operación activa
The battle between bulls and bears at key support and resistance levels for Bitcoin.🌞🌞🌞The market only moves in one direction, neither bullish nor bearish, but in the right direction.✔✔✔
📶📶📶Free trading signals:t.me/+Yxg-9qunpEA5YmU0
📶📶📶Free trading signals:t.me/+Yxg-9qunpEA5YmU0
Exención de responsabilidad
La información y las publicaciones no constituyen, ni deben considerarse como asesoramiento o recomendaciones financieras, de inversión, de trading o de otro tipo proporcionadas o respaldadas por TradingView. Más información en Condiciones de uso.
🌞🌞🌞The market only moves in one direction, neither bullish nor bearish, but in the right direction.✔✔✔
📶📶📶Free trading signals:t.me/+Yxg-9qunpEA5YmU0
📶📶📶Free trading signals:t.me/+Yxg-9qunpEA5YmU0
Exención de responsabilidad
La información y las publicaciones no constituyen, ni deben considerarse como asesoramiento o recomendaciones financieras, de inversión, de trading o de otro tipo proporcionadas o respaldadas por TradingView. Más información en Condiciones de uso.