1️⃣ Macro Structure: Lower Highs + Ascending Support
Bitcoin Dominance has been forming:
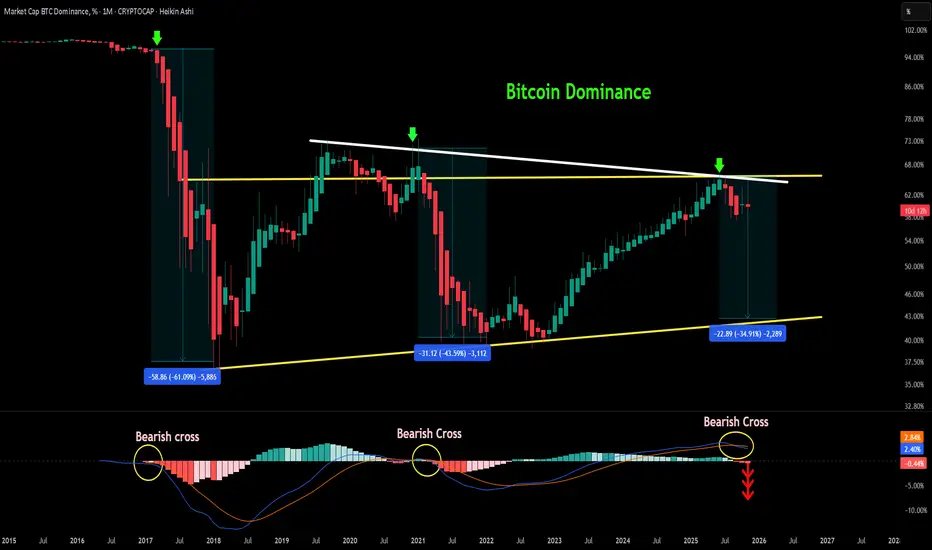
✔ Descending trendline of lower highs (2017 → 2021 → 2025)
✔ Rising major support (long-term uptrend on lows)
This creates a large symmetrical wedge structure. Each time price hits the upper resistance, a strong rejection follows.
2️⃣ MACD Signals Confirm Top Rejection
Every dominance cycle peak shows a:
🔸 Monthly MACD Bearish Cross
Shown in:
✔ Late 2017
✔ Early 2021
✔ Now — 2025 cross forming
MACD momentum is rolling over → signaling shift from BTC to altcoins
3️⃣ Market Implication
Historically when BTC dominance falls:
🚀 Capital flows from BTC → Altcoins
🔥 Strong alt seasons follow
💡 Smart time for rotation strategies
🎯 Key Probable Path
If the pattern repeats:
📌 Dominance drop target: ≈ 45% – 47%
📌 Altcoins market cap expansion: +200–500% (historical behavior)
📌 Duration: ~12-18 months based on cycle symmetry
Biggest winners typically:
ETH-led majors
High-liquidity mid caps
AI, RWA, Gaming sectors (cycle hype rotation)
4️⃣ Additional Observations
⚠️ BTC dominance long-term support (yellow trendline) is approaching
Meaning:
➡ First: Altseason mania
➡ Then: Possible cycle top market-wide
📌 Final Bias
Bitcoin Dominance chart strongly supports:
“Altseason Phase is starting — Bitcoin dominance has topped.”
🟢 Accumulation of strong alts
🟡 Reduce BTC overweight
🔴 Watch for dominance breakdown confirmation below 58%
Every time dominance peaks, altcoins explode… Then the floor disappears.
The clock is ticking.
This signal has never missed.
Bitcoin Dominance has been forming:
✔ Descending trendline of lower highs (2017 → 2021 → 2025)
✔ Rising major support (long-term uptrend on lows)
This creates a large symmetrical wedge structure. Each time price hits the upper resistance, a strong rejection follows.
2️⃣ MACD Signals Confirm Top Rejection
Every dominance cycle peak shows a:
🔸 Monthly MACD Bearish Cross
Shown in:
✔ Late 2017
✔ Early 2021
✔ Now — 2025 cross forming
MACD momentum is rolling over → signaling shift from BTC to altcoins
3️⃣ Market Implication
Historically when BTC dominance falls:
🚀 Capital flows from BTC → Altcoins
🔥 Strong alt seasons follow
💡 Smart time for rotation strategies
🎯 Key Probable Path
If the pattern repeats:
📌 Dominance drop target: ≈ 45% – 47%
📌 Altcoins market cap expansion: +200–500% (historical behavior)
📌 Duration: ~12-18 months based on cycle symmetry
Biggest winners typically:
ETH-led majors
High-liquidity mid caps
AI, RWA, Gaming sectors (cycle hype rotation)
4️⃣ Additional Observations
⚠️ BTC dominance long-term support (yellow trendline) is approaching
Meaning:
➡ First: Altseason mania
➡ Then: Possible cycle top market-wide
📌 Final Bias
Bitcoin Dominance chart strongly supports:
“Altseason Phase is starting — Bitcoin dominance has topped.”
🟢 Accumulation of strong alts
🟡 Reduce BTC overweight
🔴 Watch for dominance breakdown confirmation below 58%
Every time dominance peaks, altcoins explode… Then the floor disappears.
The clock is ticking.
This signal has never missed.
Exención de responsabilidad
The information and publications are not meant to be, and do not constitute, financial, investment, trading, or other types of advice or recommendations supplied or endorsed by TradingView. Read more in the Terms of Use.
Exención de responsabilidad
The information and publications are not meant to be, and do not constitute, financial, investment, trading, or other types of advice or recommendations supplied or endorsed by TradingView. Read more in the Terms of Use.