BNB/USDT Weekly Chart Update
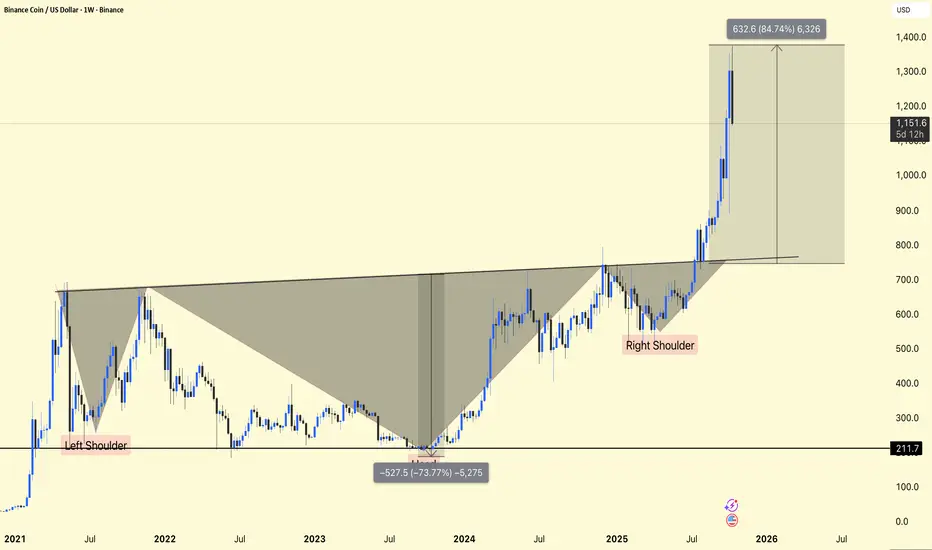
BNB has completed a massive inverse head and shoulders pattern on the weekly timeframe – a strong bullish reversal structure that confirms the long-term uptrend.
After breaking the $750 neckline, the price quickly rose to $1,230+, representing a gain of approximately +85% from the breakout zone. Current price activity remains strong, but a short-term decline towards $1,000-$1,100 would be good for continued downside.
Support: $800-$850 (neckline retest zone)
Short-term support: $1,000-$1,100
Target area: $1,350-$1,400
The breakout structure is bullish and intact – declines can be viewed as accumulation opportunities for the next leg up.
DYOR | NFA
Publicaciones relacionadas
Exención de responsabilidad
La información y las publicaciones no constituyen, ni deben considerarse como asesoramiento o recomendaciones financieras, de inversión, de trading o de otro tipo proporcionadas o respaldadas por TradingView. Más información en Condiciones de uso.