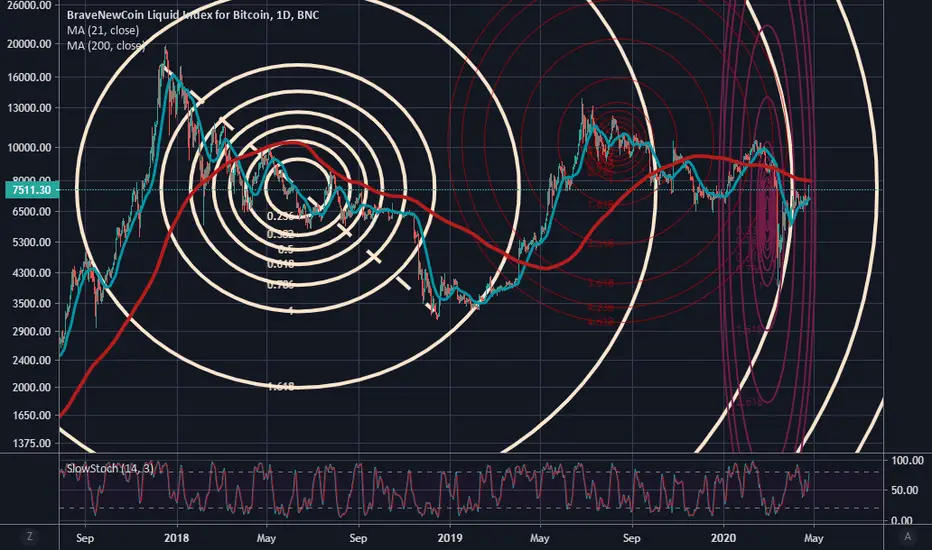
I was looking at Fib circles and there appears to be a dump at the "1" Fib ring line when plotting from highest point to lowest point. not sure if this has any predictive value. but the 2017 pump until the 2018 dump was about 13 months to reach the 1 Fib circle, same for the 2nd Fib cirlce. the third took place a little over month (perhaps that dump was intra-annual price action). Not sure what to make of it.
Nota
2017 pump to 2018 dump was 12 months.Nota
obviously in the 2017 pump, there was a double top where the 2nd top was lower than the first, and same for summer 2019 pump. but on the macro level, 2017 and 2019 form their own double top, the 2019 being smaller than 2017, which means bearish to me in the medium term future (6 months)Exención de responsabilidad
La información y las publicaciones que ofrecemos, no implican ni constituyen un asesoramiento financiero, ni de inversión, trading o cualquier otro tipo de consejo o recomendación emitida o respaldada por TradingView. Puede obtener información adicional en las Condiciones de uso.
Exención de responsabilidad
La información y las publicaciones que ofrecemos, no implican ni constituyen un asesoramiento financiero, ni de inversión, trading o cualquier otro tipo de consejo o recomendación emitida o respaldada por TradingView. Puede obtener información adicional en las Condiciones de uso.