Detailed Analysis & Trade Idea
1. Trend Context
From Jan–Mar 2025, the stock went into a sharp downtrend, losing nearly 40–45% of its value.
After that fall, it formed a base around ₹420–₹460 during July–September. This base acts as a demand zone where buyers stepped in repeatedly.
Recently, prices started moving higher from this base, supported by rising trading volumes (a strong sign that institutions might be accumulating).
2. Current Price Action
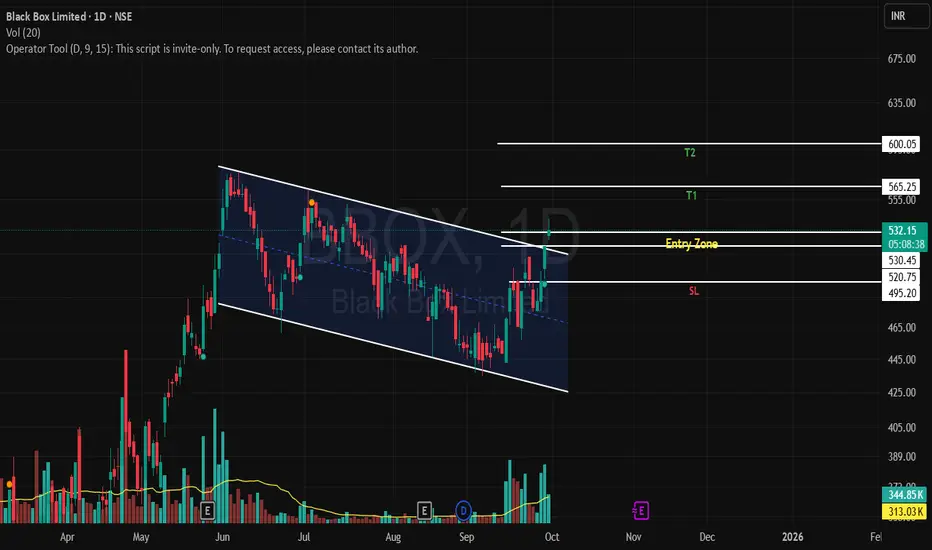
As of now, the stock is at ₹534.05.
Today's candlestick shows a strong bullish close near the day's high (buyers in control).
Price has broken above its short-term resistance zone around ₹520–530, which was repeatedly tested in September.
This indicates a potential breakout from consolidation.
3. Key Levels to Watch
Immediate Resistance: ₹540–550 → This is where sellers may test strength.
Next Resistance: ₹580–600 → If momentum sustains, this zone becomes the natural target.
Supports:
₹500: Closest support (recent breakout level).
₹460: Strong base support (if the trade fails).
4. Trade Plan (Swing Long Setup)
Entry Zone: Buy on dips near ₹520–530 OR if it sustains above ₹535 with volume.
Stop Loss: Close below ₹495 (below breakout zone).
Profit Targets:
Target 1 (T1): ₹565
Target 2 (T2): ₹590–600
This gives us a Risk–Reward Ratio (RRR) of ~1:2 (risk ~35 points, reward up to ~70 points).
1. Trend Context
From Jan–Mar 2025, the stock went into a sharp downtrend, losing nearly 40–45% of its value.
After that fall, it formed a base around ₹420–₹460 during July–September. This base acts as a demand zone where buyers stepped in repeatedly.
Recently, prices started moving higher from this base, supported by rising trading volumes (a strong sign that institutions might be accumulating).
2. Current Price Action
As of now, the stock is at ₹534.05.
Today's candlestick shows a strong bullish close near the day's high (buyers in control).
Price has broken above its short-term resistance zone around ₹520–530, which was repeatedly tested in September.
This indicates a potential breakout from consolidation.
3. Key Levels to Watch
Immediate Resistance: ₹540–550 → This is where sellers may test strength.
Next Resistance: ₹580–600 → If momentum sustains, this zone becomes the natural target.
Supports:
₹500: Closest support (recent breakout level).
₹460: Strong base support (if the trade fails).
4. Trade Plan (Swing Long Setup)
Entry Zone: Buy on dips near ₹520–530 OR if it sustains above ₹535 with volume.
Stop Loss: Close below ₹495 (below breakout zone).
Profit Targets:
Target 1 (T1): ₹565
Target 2 (T2): ₹590–600
This gives us a Risk–Reward Ratio (RRR) of ~1:2 (risk ~35 points, reward up to ~70 points).
Exención de responsabilidad
La información y las publicaciones no constituyen, ni deben considerarse como asesoramiento o recomendaciones financieras, de inversión, de trading o de otro tipo proporcionadas o respaldadas por TradingView. Más información en Condiciones de uso.
Exención de responsabilidad
La información y las publicaciones no constituyen, ni deben considerarse como asesoramiento o recomendaciones financieras, de inversión, de trading o de otro tipo proporcionadas o respaldadas por TradingView. Más información en Condiciones de uso.