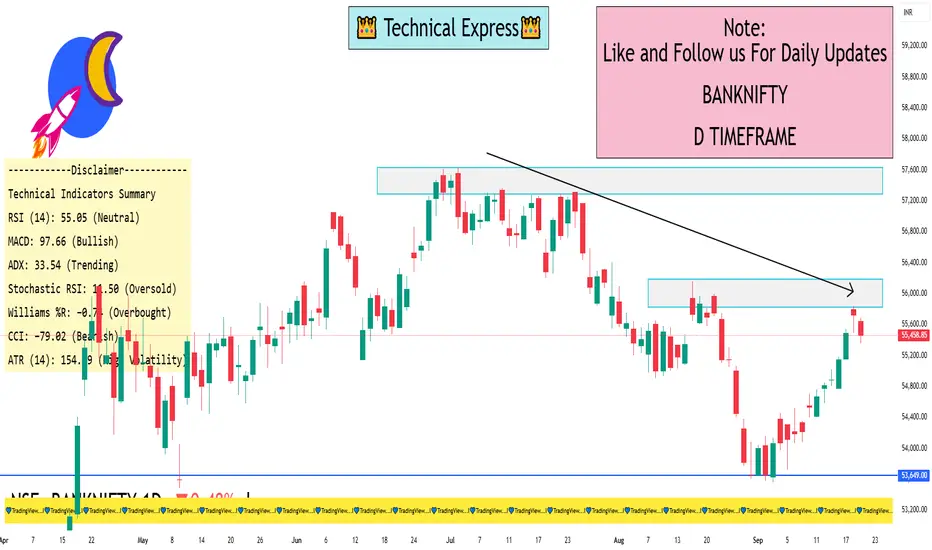
📉 Daily Price Action (Sep 19, 2025)
Closing Price: 55,458.85 (−0.48%)
Open: 55,647.95
High: 55,688.75
Low: 55,355.30
Volume: 190.00M
🔍 Technical Indicators
Relative Strength Index (RSI): Indicates momentum strength.
Moving Average Convergence Divergence (MACD): Shows trend direction and potential reversals.
Stochastic RSI: Assesses overbought or oversold conditions.
Super Trend: Signals the prevailing trend direction.
Parabolic SAR: Highlights potential reversal points.
Chaikin Money Flow (CMF): Measures the accumulation or distribution of money.
Average Directional Index (ADX): Determines trend strength.
🧭 Market Sentiment
The Nifty Bank Index experienced a decline on September 19, 2025, primarily due to profit-booking in major banking stocks, particularly HDFC Bank and ICICI Bank. Despite this, the index remains above the 55,000 level, indicating underlying strength. A sustained move above 55,600 could lead to further upside, while a break below 55,000 might indicate a bearish trend.
I built a Buy & Sell Signal Indicator with 85% accuracy.
📈 Get access via DM or
WhatsApp: wa.link/d997q0
Contact - +91 76782 40962
| Email: techncialexpress@gmail.com
| Script Coder | Trader | Investor | From India
📈 Get access via DM or
WhatsApp: wa.link/d997q0
Contact - +91 76782 40962
| Email: techncialexpress@gmail.com
| Script Coder | Trader | Investor | From India
Publicaciones relacionadas
Exención de responsabilidad
La información y las publicaciones no constituyen, ni deben considerarse como asesoramiento o recomendaciones financieras, de inversión, de trading o de otro tipo proporcionadas o respaldadas por TradingView. Más información en Condiciones de uso.