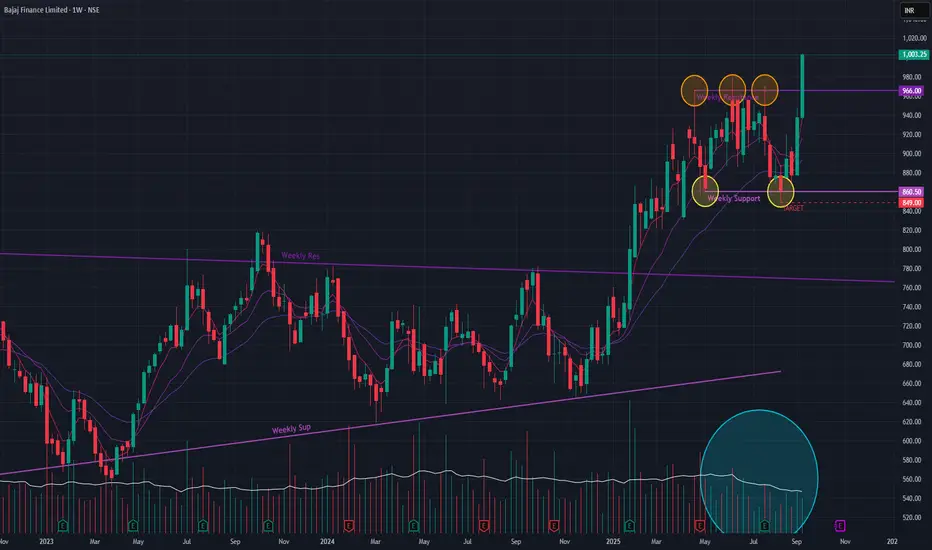
After a multi-month sideways consolidation from April to September 2025, Bajaj Finance has signaled a potential resumption of its primary uptrend. This recent price action mirrors a similar pattern seen from October 2021 to January 2025, which was followed by a powerful rally to new all-time highs.
## Recent Bullish Developments 📈
Pattern Breakout: The stock decisively broke out of its recent sideways range last week, surging +7% on strong volume & a new ATH. This move indicates a shift from balance to imbalance, with buyers taking firm control.
Sustained Momentum: The buying pressure has continued, resulting in a rally of over 14% in the past two weeks.
Technical Confirmation: The short-term Exponential Moving Averages (EMAs) are in a Positive Crossover (PCO) state, a classic bullish indicator that supports the case for continued upward momentum.
## Outlook and Key Levels
The breakout suggests that the stock is poised to challenge its previous highs.
Upside Potential: If the current momentum is sustained, the next logical price target in the near term is the ₹1,077 level.
Downside Risk: Should the breakout fail and momentum wane, the stock could pull back to test the support zone around ₹849.
The key factor to watch is trading volume. While the initial breakout volume was good, sustained buying interest is needed to fuel the next leg of the rally.
Disclaimer: This analysis is my personal view & for educational purposes only. They shall not be construed as trade or investment advice. Before making any financial decision, it is imperative that you consult with a qualified financial professional.
Exención de responsabilidad
La información y las publicaciones que ofrecemos, no implican ni constituyen un asesoramiento financiero, ni de inversión, trading o cualquier otro tipo de consejo o recomendación emitida o respaldada por TradingView. Puede obtener información adicional en las Condiciones de uso.